Introduction
2024 presented unique challenges for American pets and their owners. From devastating hurricanes to wildfires and severe storms, our animal companions found themselves particularly vulnerable during these crises. According to our comprehensive research, more than 1.7 million pets were reported lost nationwide in just one year—and it's not just cats and dogs. Approximately 142,000 other animals became separated from their owners as well.
While numerous studies examine the costs of pet ownership—from food and medical care to grooming—there's a notable absence of research on the true cost of losing a pet. Though it's possible to calculate expenses for advertisements, shelter fees, and search equipment, the emotional toll is immeasurable. Those animals that never returned home often remain on the streets or end up in shelters, with their care becoming a burden on government resources. According to the Dakin Humane Society (Massachusetts), the average cost per sheltered animal reached $950 in 2024—an increase attributed to inflation and a rising percentage of animals requiring specialized medical or behavioral care.
For many owners, losing a pet is comparable to losing a family member—a devastating experience that transcends financial considerations. Pets that have never been reunited with their owners often remain on the streets or end up in shelters, with their care becoming a burden on government resources.
At Pet911, we've conducted an extensive analysis of lost and found pet data throughout 2024, analyzing over 1 million pet listings from our database and social media. The study involved a random digit dial survey of pet guardians, volunteers, and industry experts. Our goal? To identify key patterns and insights that can help pet owners better understand risks and take proactive measures to protect their beloved companions.
Key Findings About Lost Pets in US 2024
- More than 1.7 million lost pets nationwide
- In 2024, 63% of lost dogs and 52% of lost cats were successfully recovered
- Texas leads with 82,515 cases of lost dogs
- New Jersey leads with 18,580 cases of lost cats
- 75% of dogs go missing in rural states.
- July is the most dangerous month for pets - 40% of losses occur during this time of year.
- Huskies are the most frequently lost dog (7%)
- Siamese cats are the most frequently lost cat (8%)
- Montana, Connecticut and South Dacota are the states with the lowest volunteer community engagement
- Pets are most likely to go missing on Fridays, with the number of lost pet reports increasing on that day.
- Bella and Luna are the most popular names for lost pets.
More than 1.7 million lost pets nationwide
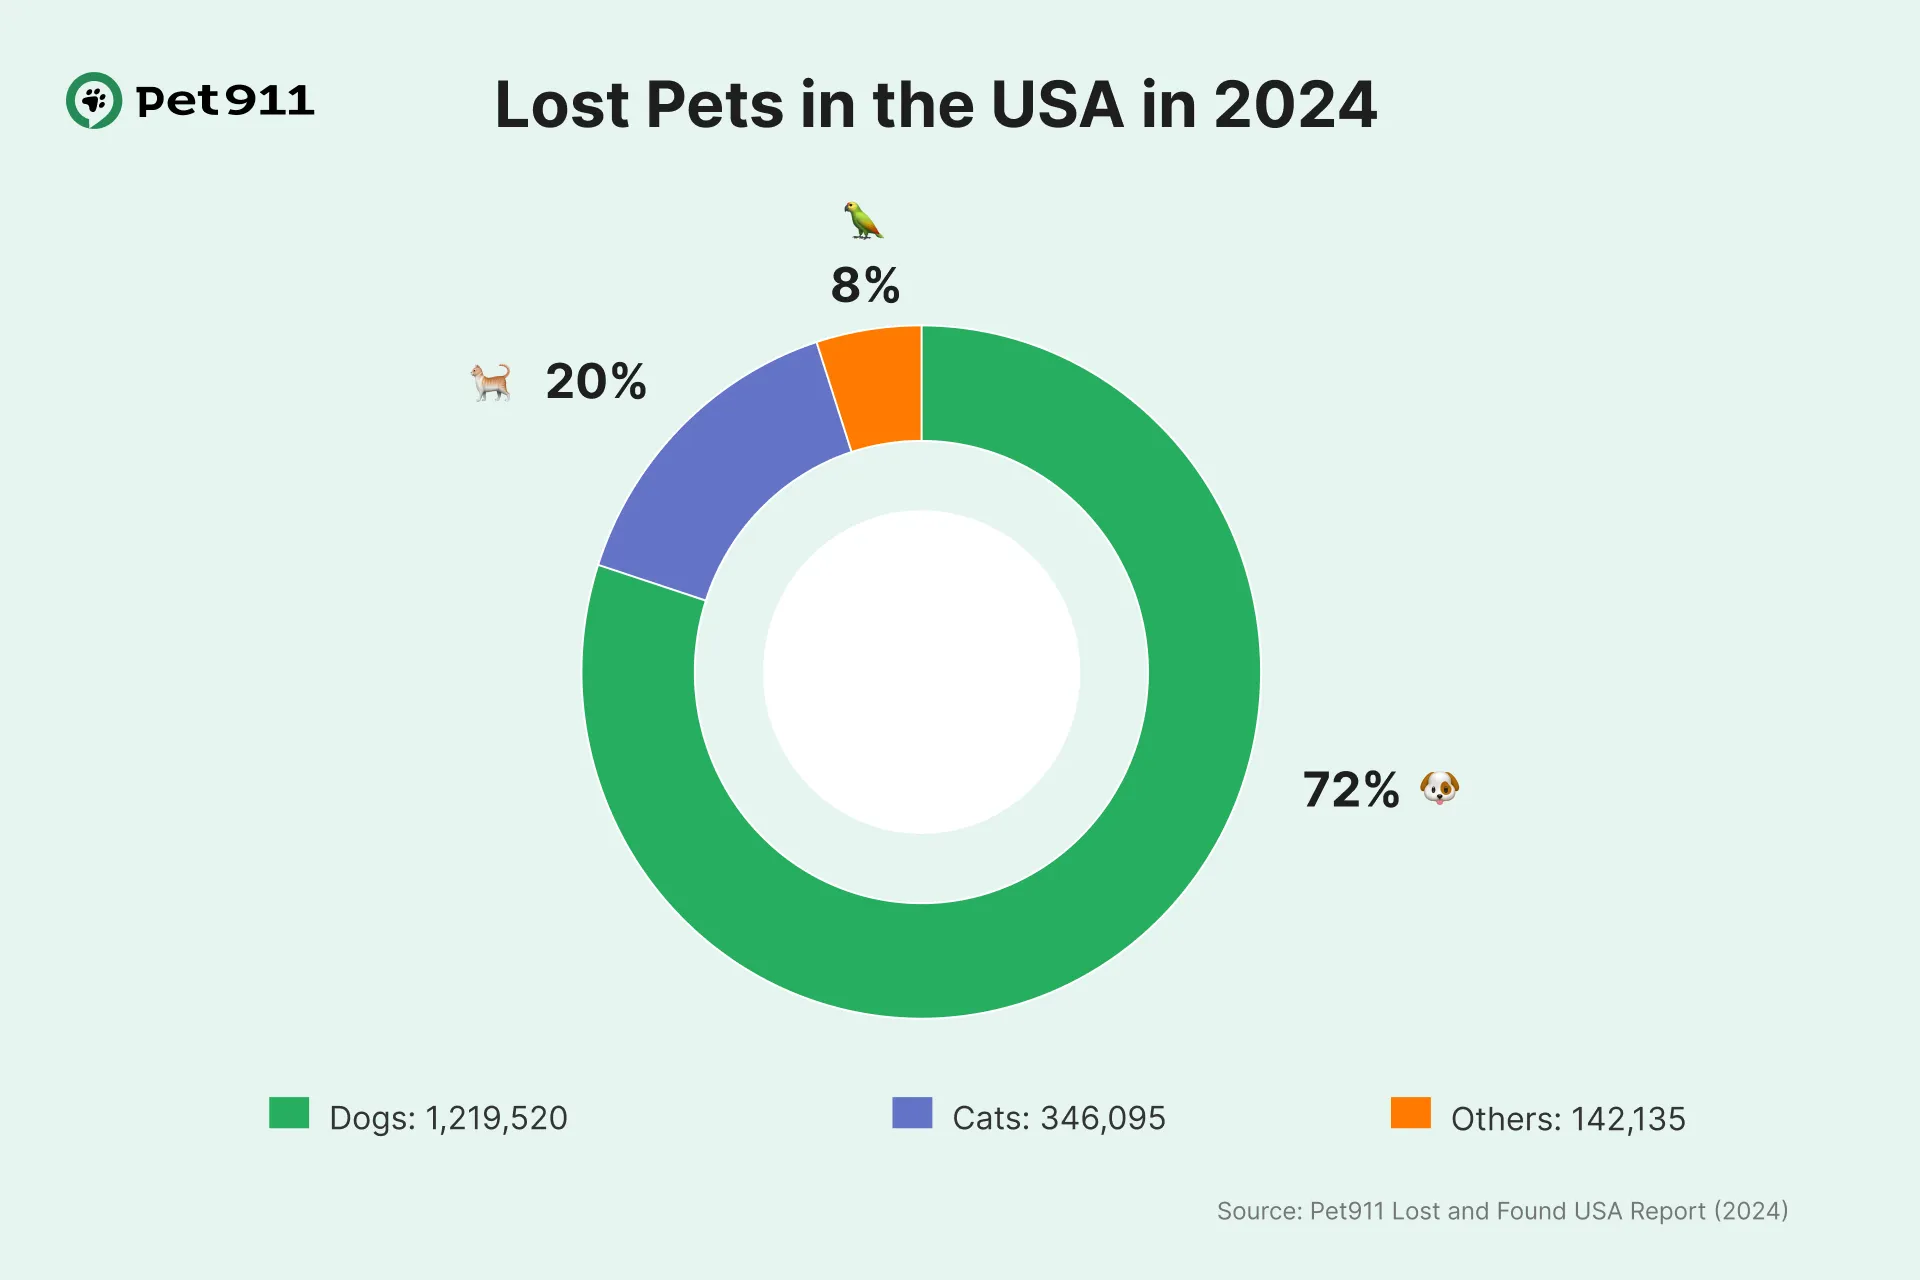
Our analysis identified approximately 1.7 million pets that went missing across the United States in 2024. The breakdown by species reveals:
- Dogs: 72% (1,219,520)
- Cats: 20% (346,095)
- Other animals: 8% (142,135)
Among the "other animals" category, our findings indicate:
- Birds: 49% (represent nearly half of all non-cat/dog missing pets)
- Rabbits: 6%
- Turtles: 6%
- Horses: 4.8%
- Ferrets: 3.5%
Interestingly, our research uncovered that some pet owners have utilized social networks to search for more unusual companions, including goats, pigs, and even snakes.
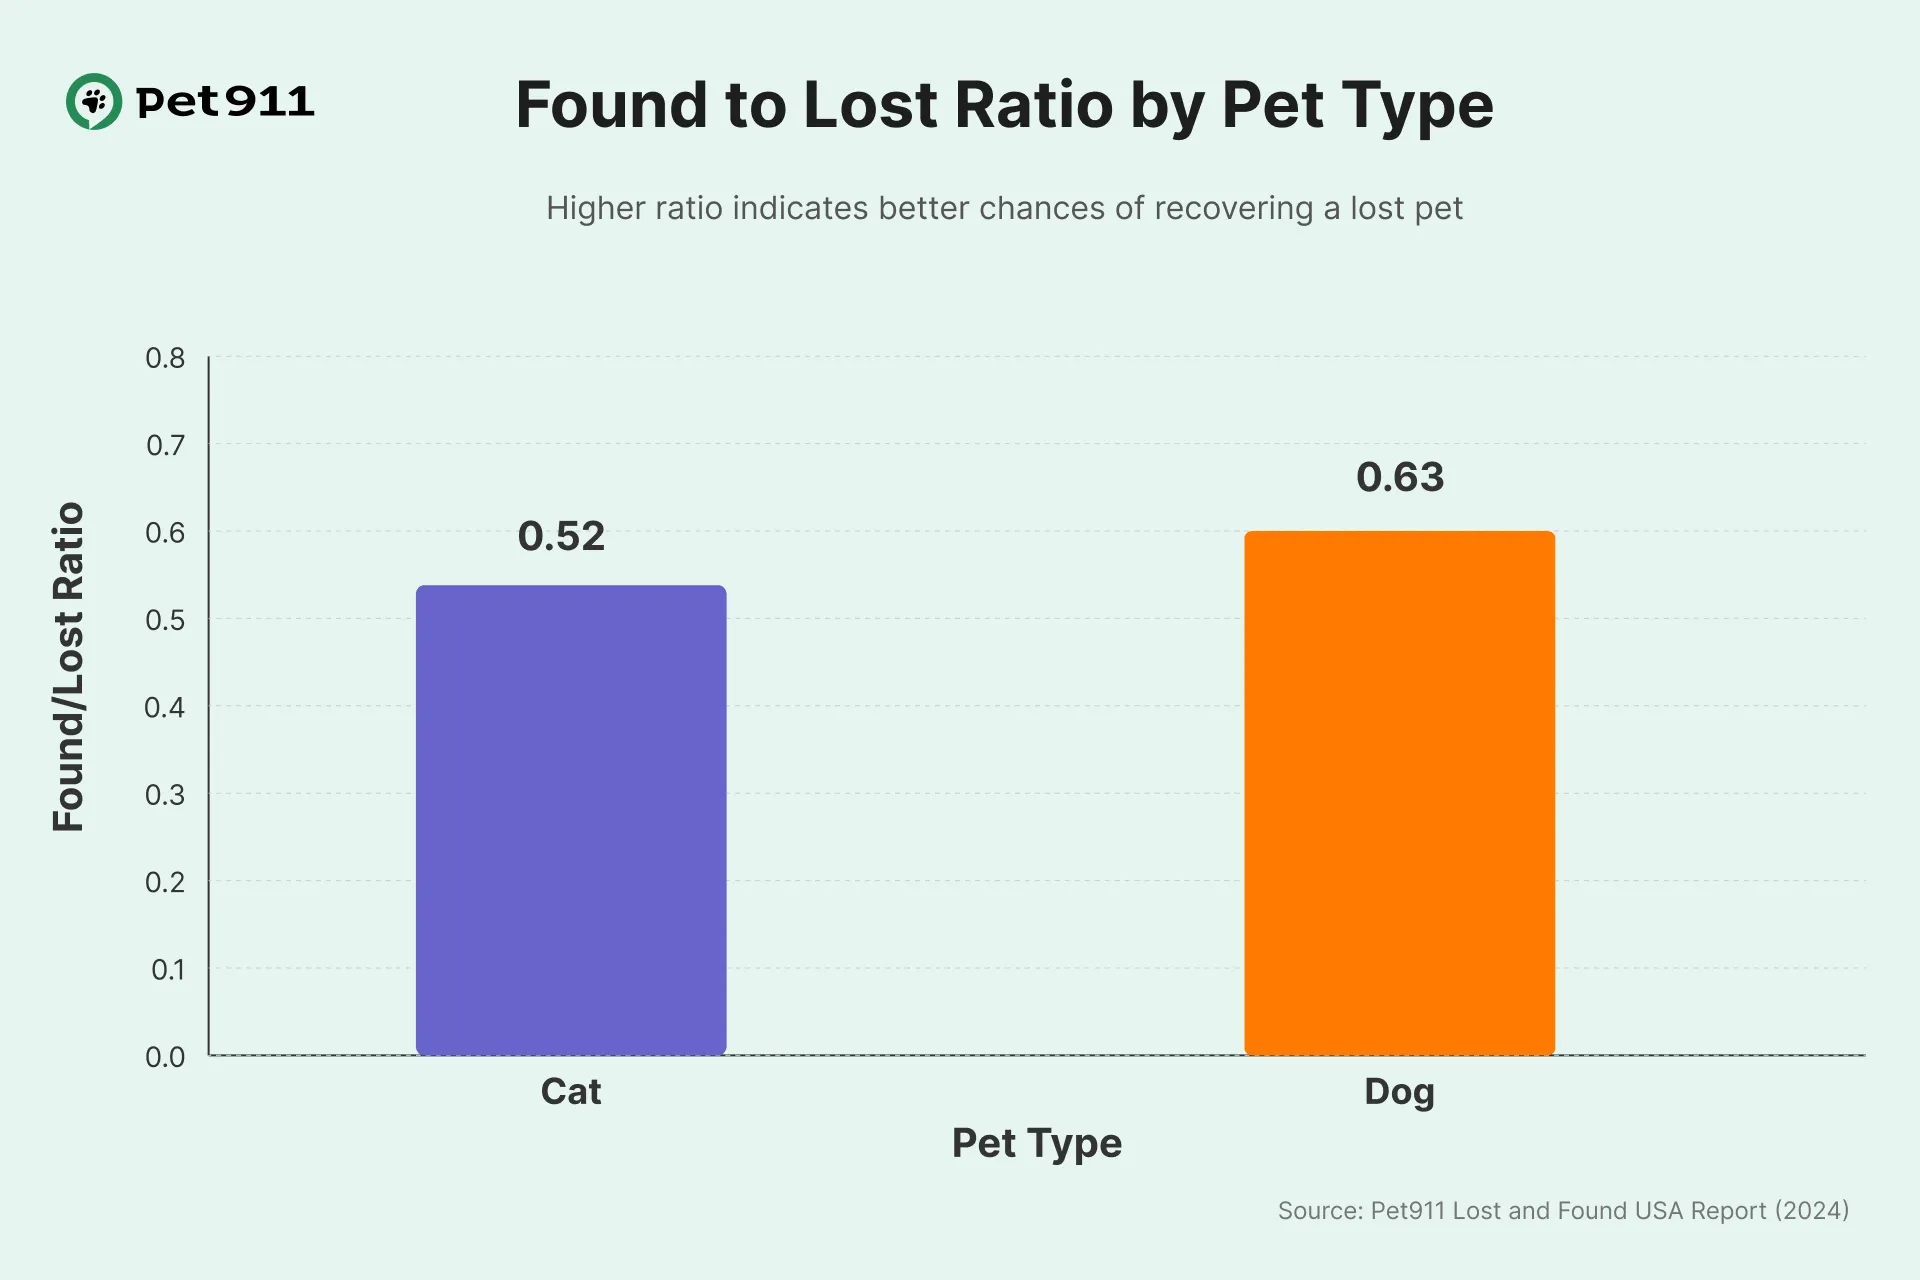
In 2024, 63% of lost dogs and 52% of lost cats were successfully recovered
We analyzed the recovery rates of these two primary pet groups and visualized this relationship in the chart below. Dogs have an 11% higher chance of being found compared to their feline counterparts. As shown in our visualization, the found-to-lost ratio for dogs stands at 0.63, while cats demonstrate a lower ratio of 0.52.
This disparity stems from both the larger number of dog enthusiasts nationwide and the behavioral differences between these animal types. Cats often hide in nearby secluded places like basements, behave more cautiously, and only emerge from their hiding spots at night. Dogs, meanwhile, experience less stress outdoors, are more approachable to humans, and are generally more visible and active.
Regional Patterns in Pet Loss
We wanted to understand how regional factors influence pet loss incidents. By analyzing lost pet reports on a state-by-state basis, we discovered some fascinating geographical patterns.
Our data reveals a clear regional divide: Southern states consistently report higher numbers of lost dogs, while Northeastern states show significantly higher rates of lost cats. This geographical distribution raises important questions about regional pet ownership habits, housing conditions, and local hazards that may contribute to these patterns.
Number of Lost Dogs and Cats in the US by State (2024)
| State | Abbreviation | Dogs | Cats |
|---|---|---|---|
| Alabama | AL | 23240 | 4140 |
| Alaska | AK | 1090 | 530 |
| Arizona | AZ | 56370 | 8875 |
| Arkansas | AR | 23010 | 3470 |
| California | CA | 47860 | 10055 |
| Colorado | CO | 32515 | 7265 |
| Connecticut | CT | 11225 | 5815 |
| Delaware | DE | 8255 | 4545 |
| Florida | FL | 43770 | 8070 |
| Georgia | GA | 46800 | 10390 |
| Hawaii | HI | 5260 | 1940 |
| Idaho | ID | 10090 | 3945 |
| Illinois | IL | 38605 | 12905 |
| Indiana | IN | 34155 | 12020 |
| Iowa | IA | 4425 | 2370 |
| Kansas | KS | 24085 | 5510 |
| Kentucky | KY | 22215 | 7370 |
| Louisiana | LA | 6630 | 1205 |
| Maine | ME | 5800 | 6800 |
| Maryland | MD | 14575 | 4285 |
| Massachusetts | MA | 12795 | 13010 |
| Michigan | MI | 36920 | 12470 |
| Minnesota | MN | 10490 | 6090 |
| Mississippi | MS | 25965 | 2810 |
| Missouri | MO | 33485 | 7330 |
| Montana | MT | 4410 | 1175 |
| Nebraska | NE | 3780 | 2235 |
| Nevada | NV | 18150 | 3190 |
| New Hampshire | NH | 1785 | 2140 |
| New Jersey | NJ | 37090 | 18580 |
| New Mexico | NM | 6525 | 1485 |
| New York | NY | 30890 | 11385 |
| North Carolina | NC | 41265 | 6290 |
| North Dakota | ND | 585 | 205 |
| Ohio | OH | 19185 | 3555 |
| Oklahoma | OK | 25445 | 3165 |
| Oregon | OR | 16450 | 11670 |
| Pennsylvania | PA | 21770 | 9150 |
| Rhode Island | RI | 9830 | 10930 |
| South Carolina | SC | 12700 | 1505 |
| South Dakota | SD | 155 | 15 |
| Tennessee | TN | 58035 | 12105 |
| Texas | TX | 82515 | 9545 |
| Utah | UT | 32575 | 15165 |
| Vermont | VT | 2615 | 3120 |
| Virginia | VA | 35345 | 9450 |
| Washington | WA | 10685 | 5605 |
| West Virginia | WV | 12480 | 2925 |
| Wisconsin | WI | 6120 | 1360 |
| Wyoming | WY | 950 | 305 |
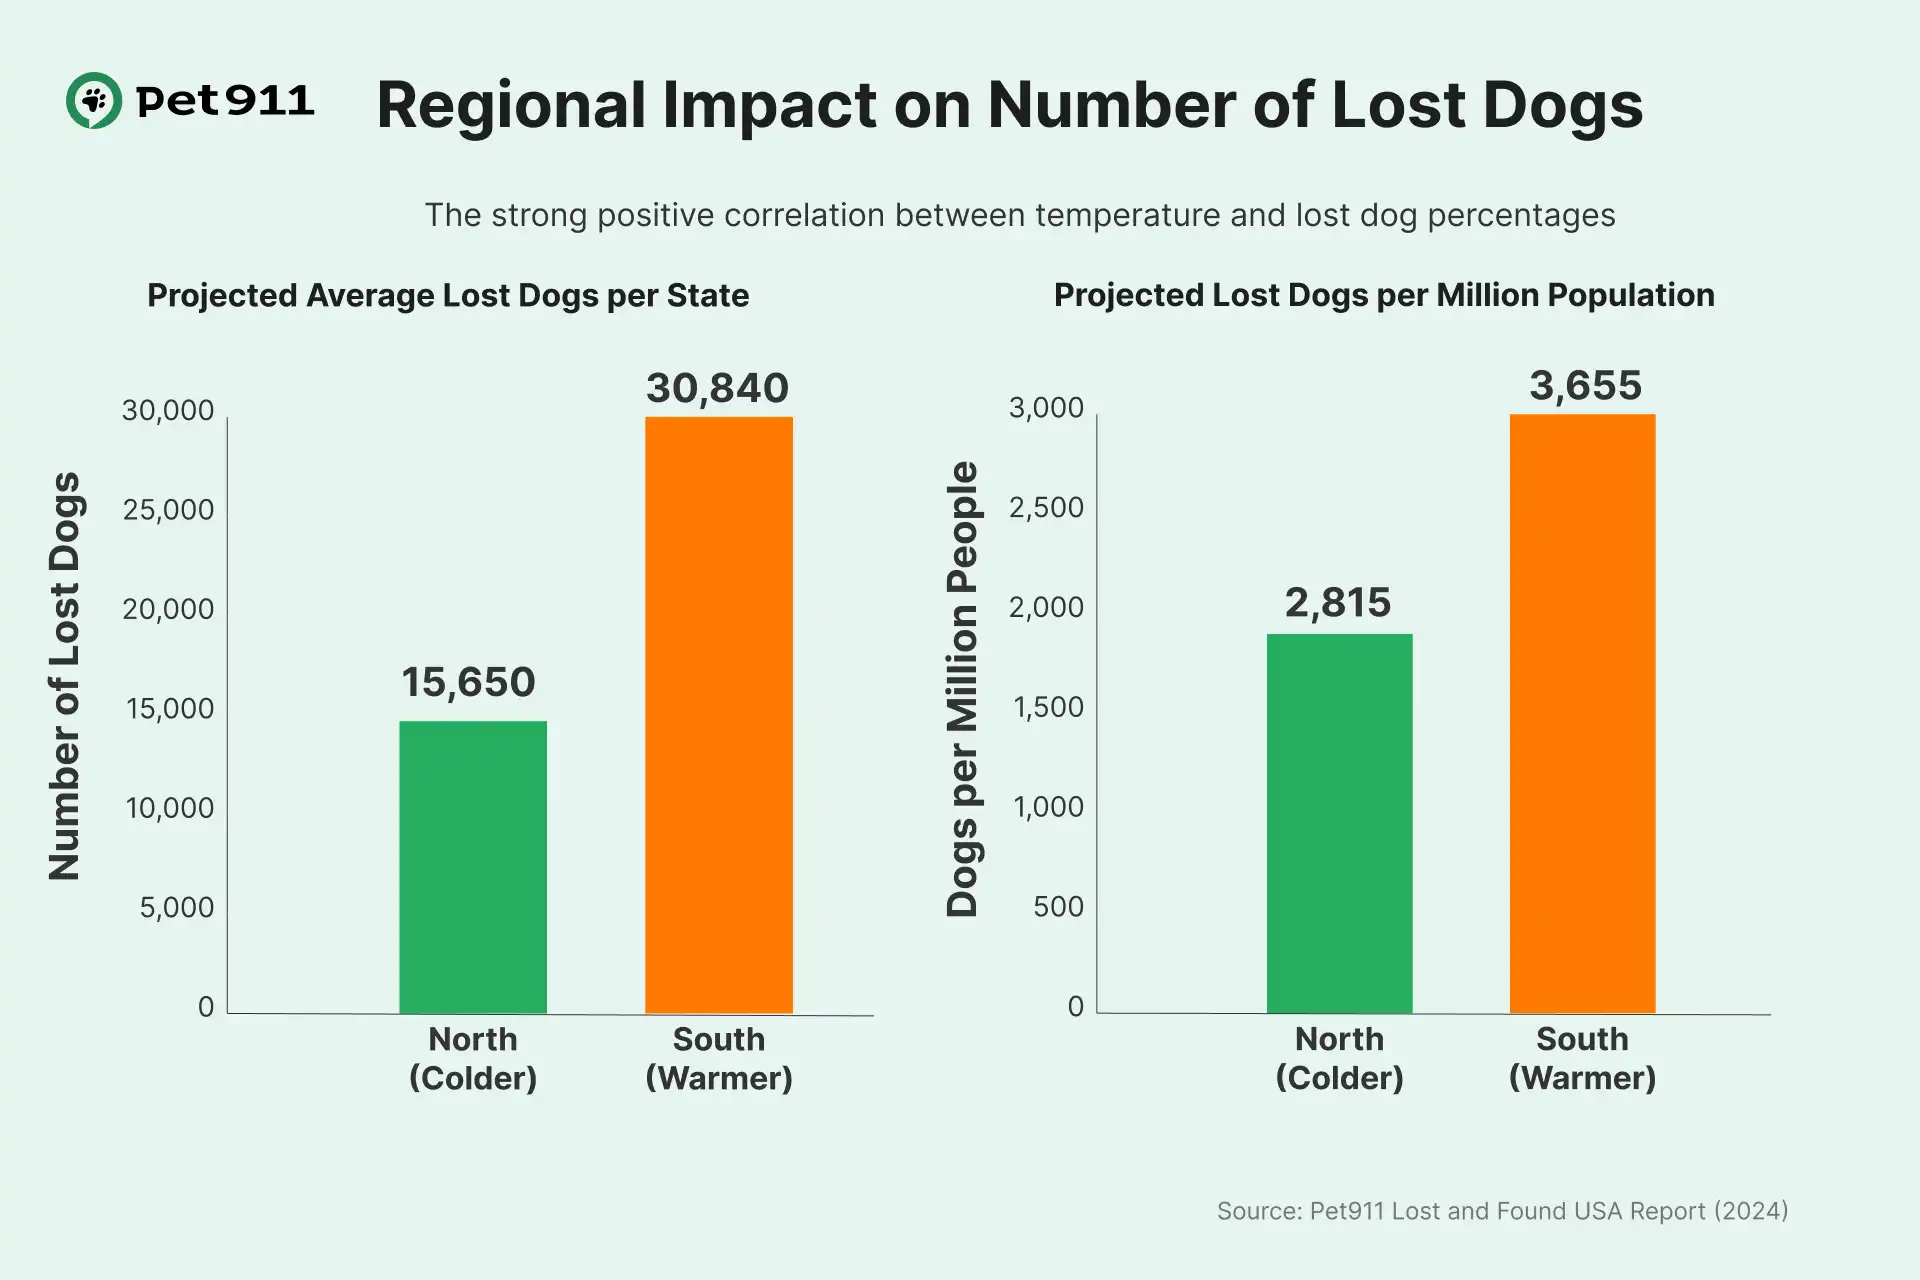
Another significant trend we've observed across all countries where Pet911 operates is the strong positive correlation between temperature and lost dog rates. Warmer southern regions consistently show higher probabilities of pet loss incidents. In America, this difference is particularly dramatic — the rate of lost dogs in hot climate states is nearly twice the national state average.
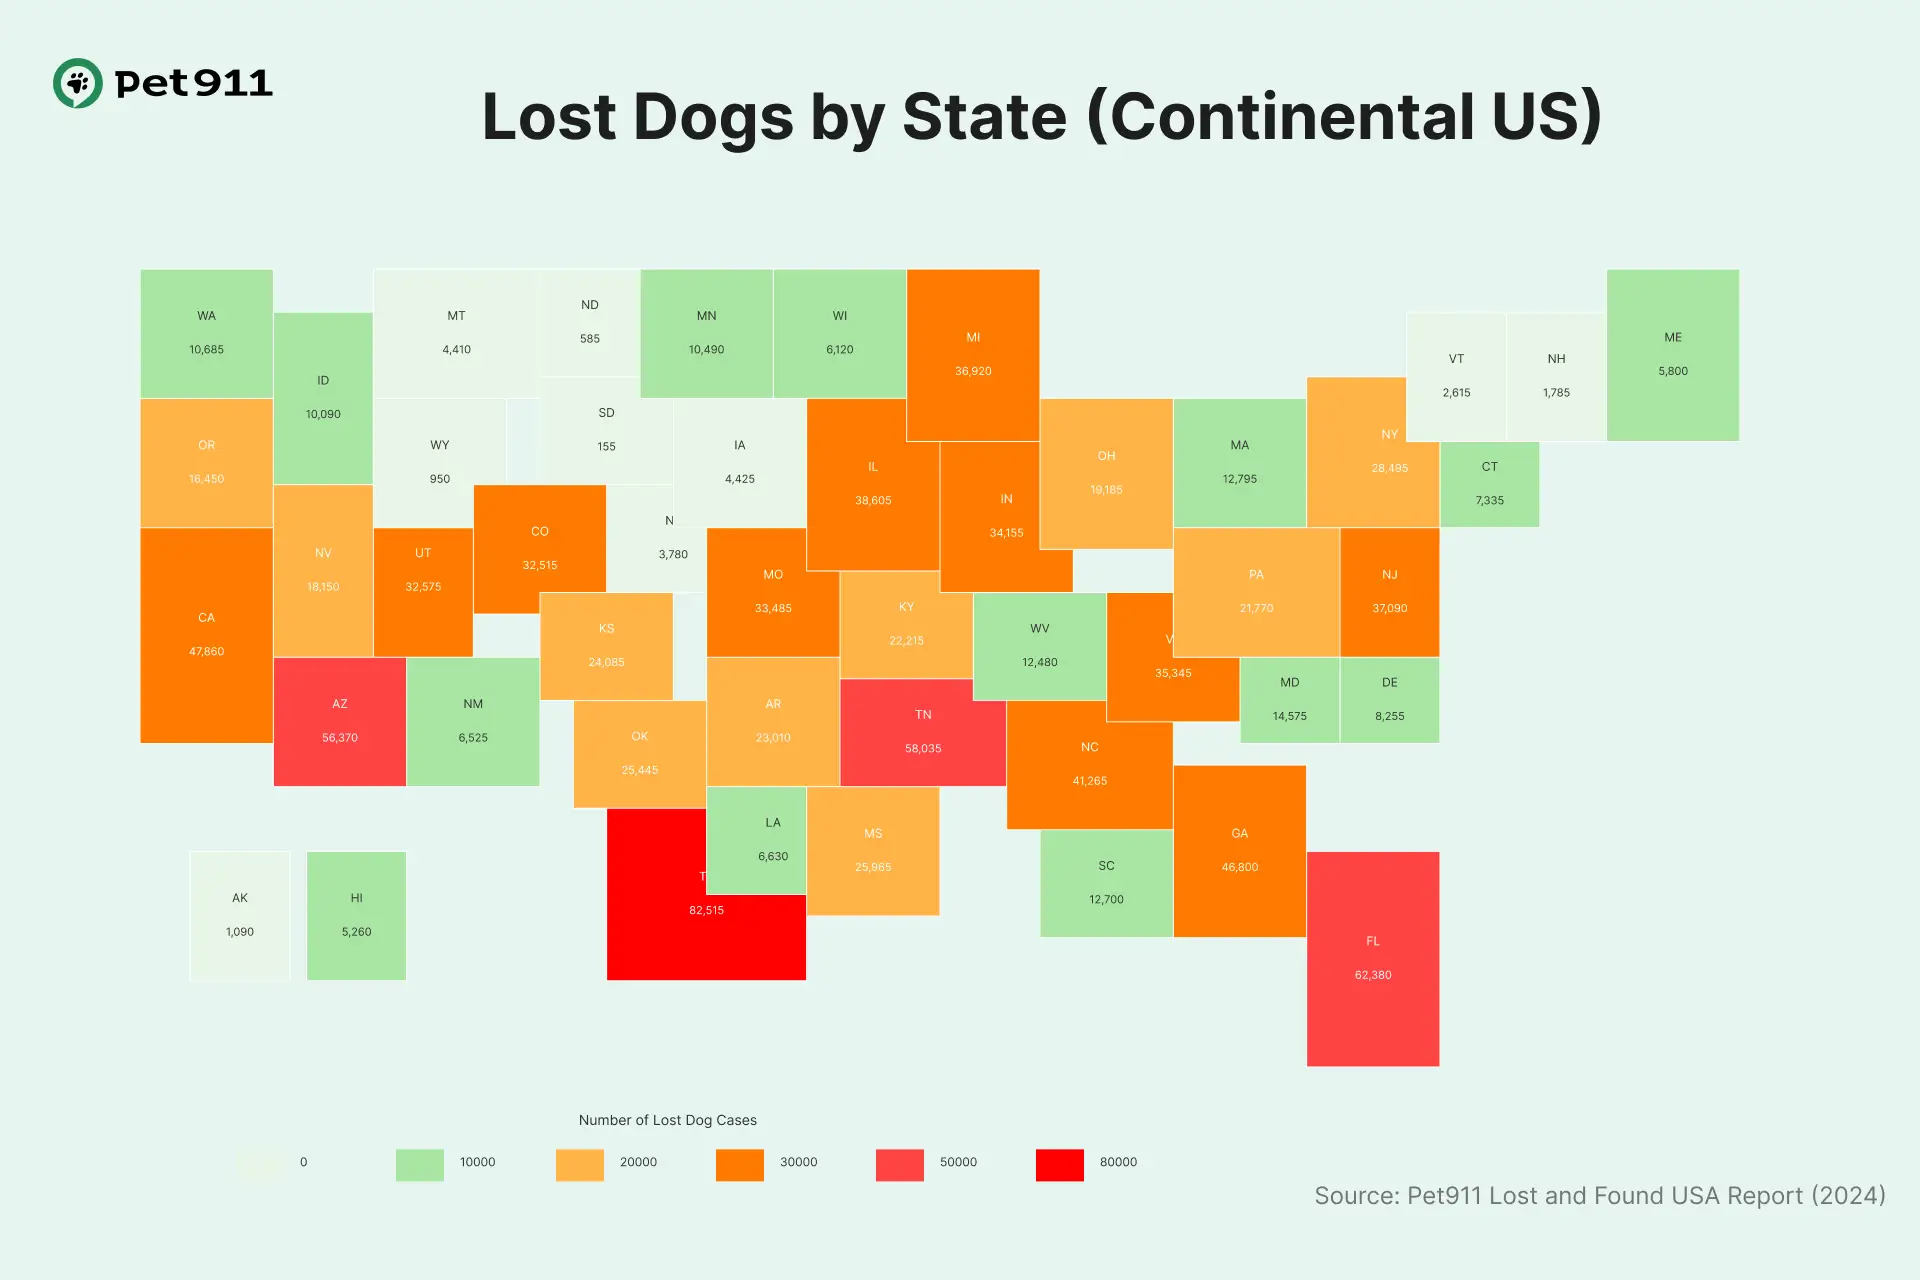
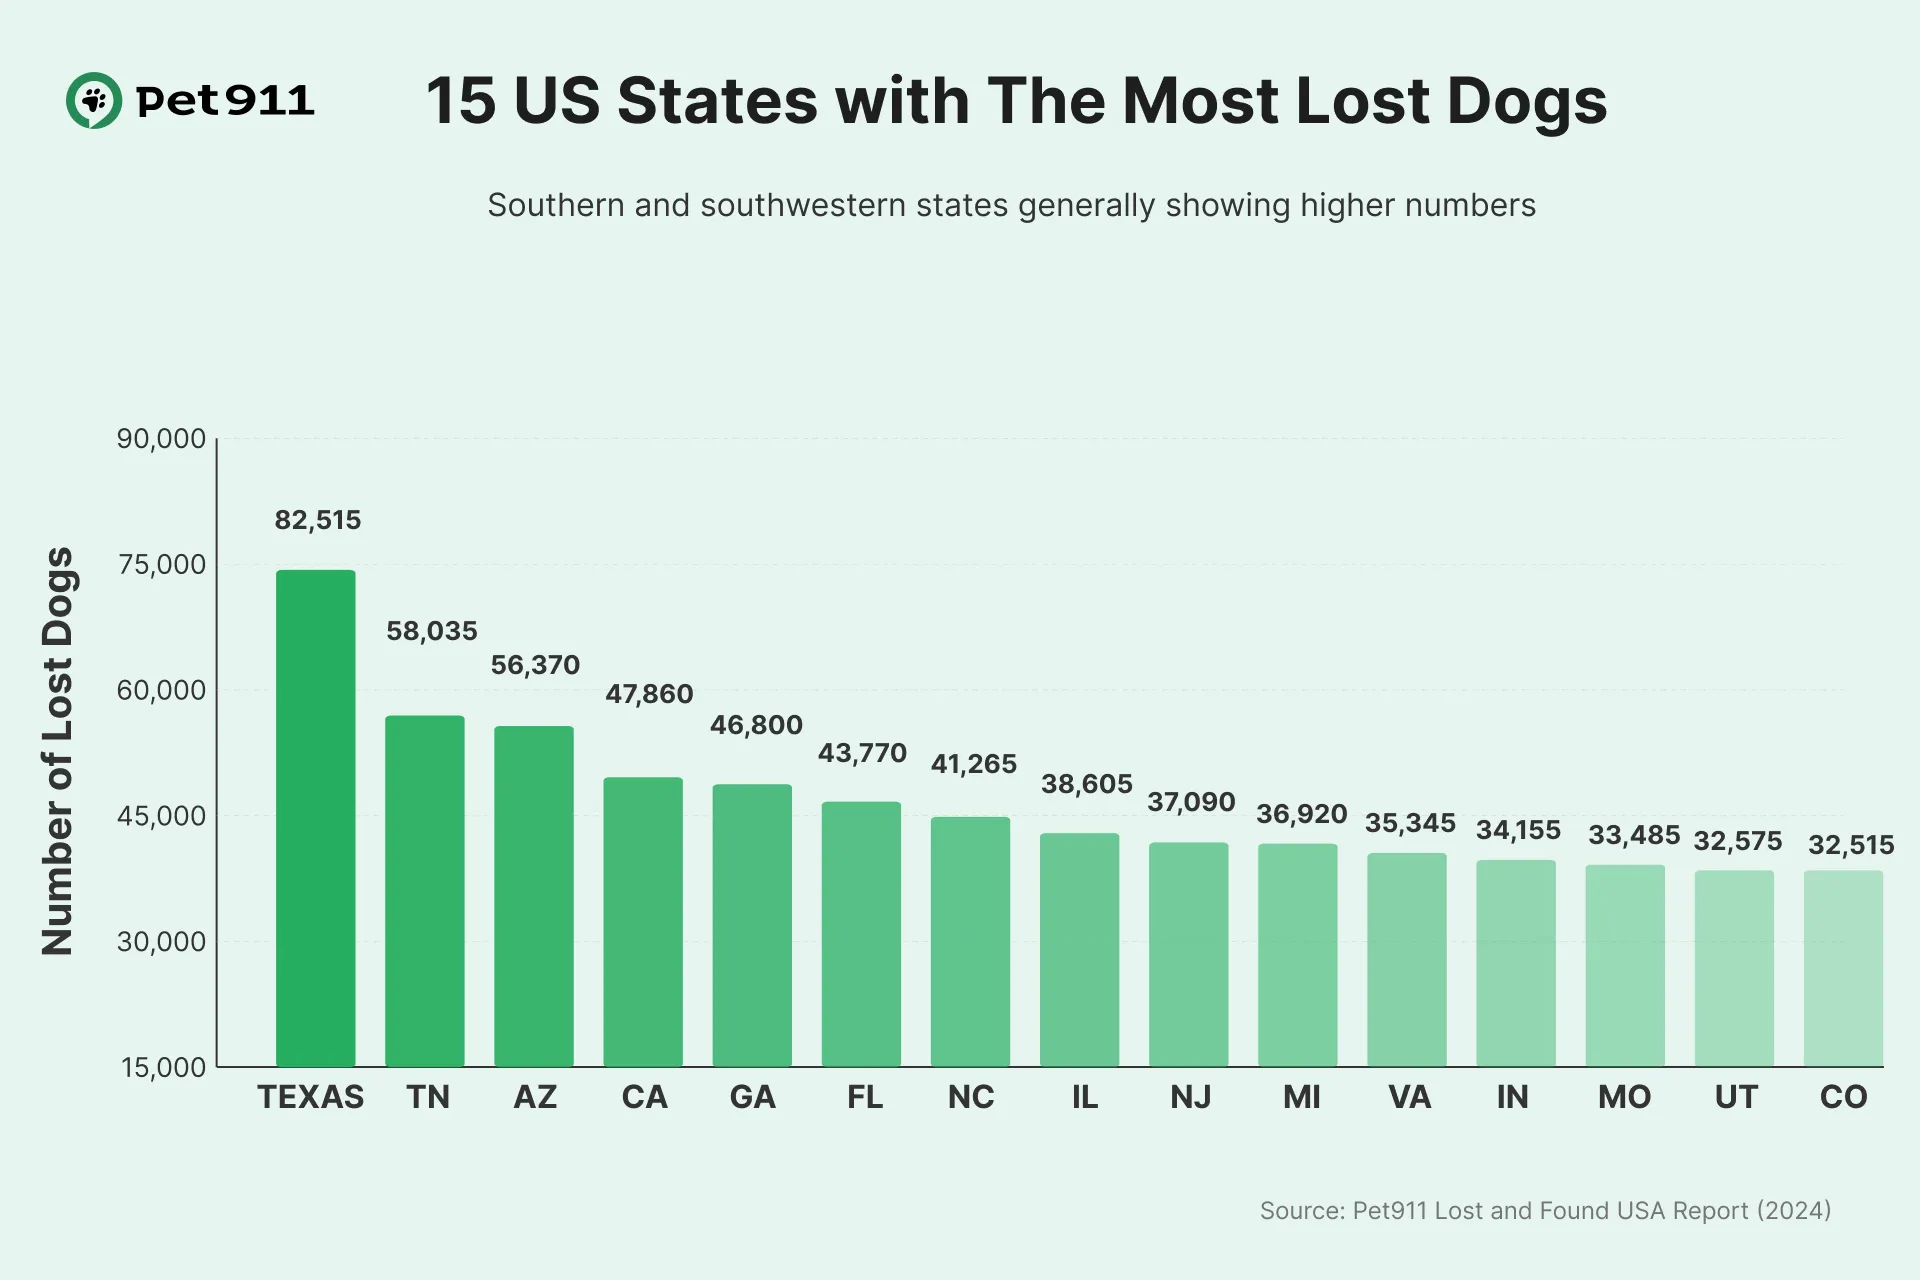
Texas leads with 82,515 cases of lost dogs
Want to know where dogs go missing most frequently? Our research has identified the states leading this concerning trend, with Southern and Southwestern regions showing particularly troubling numbers.
Texas reports over 82,500 lost dogs in 2024 — the highest figure nationwide. Following at a considerable distance are Tennessee (58,035) and Arizona (56,370). Interestingly, California, despite being America's most populous state, ranks only fourth with 47,860 lost dogs reported.
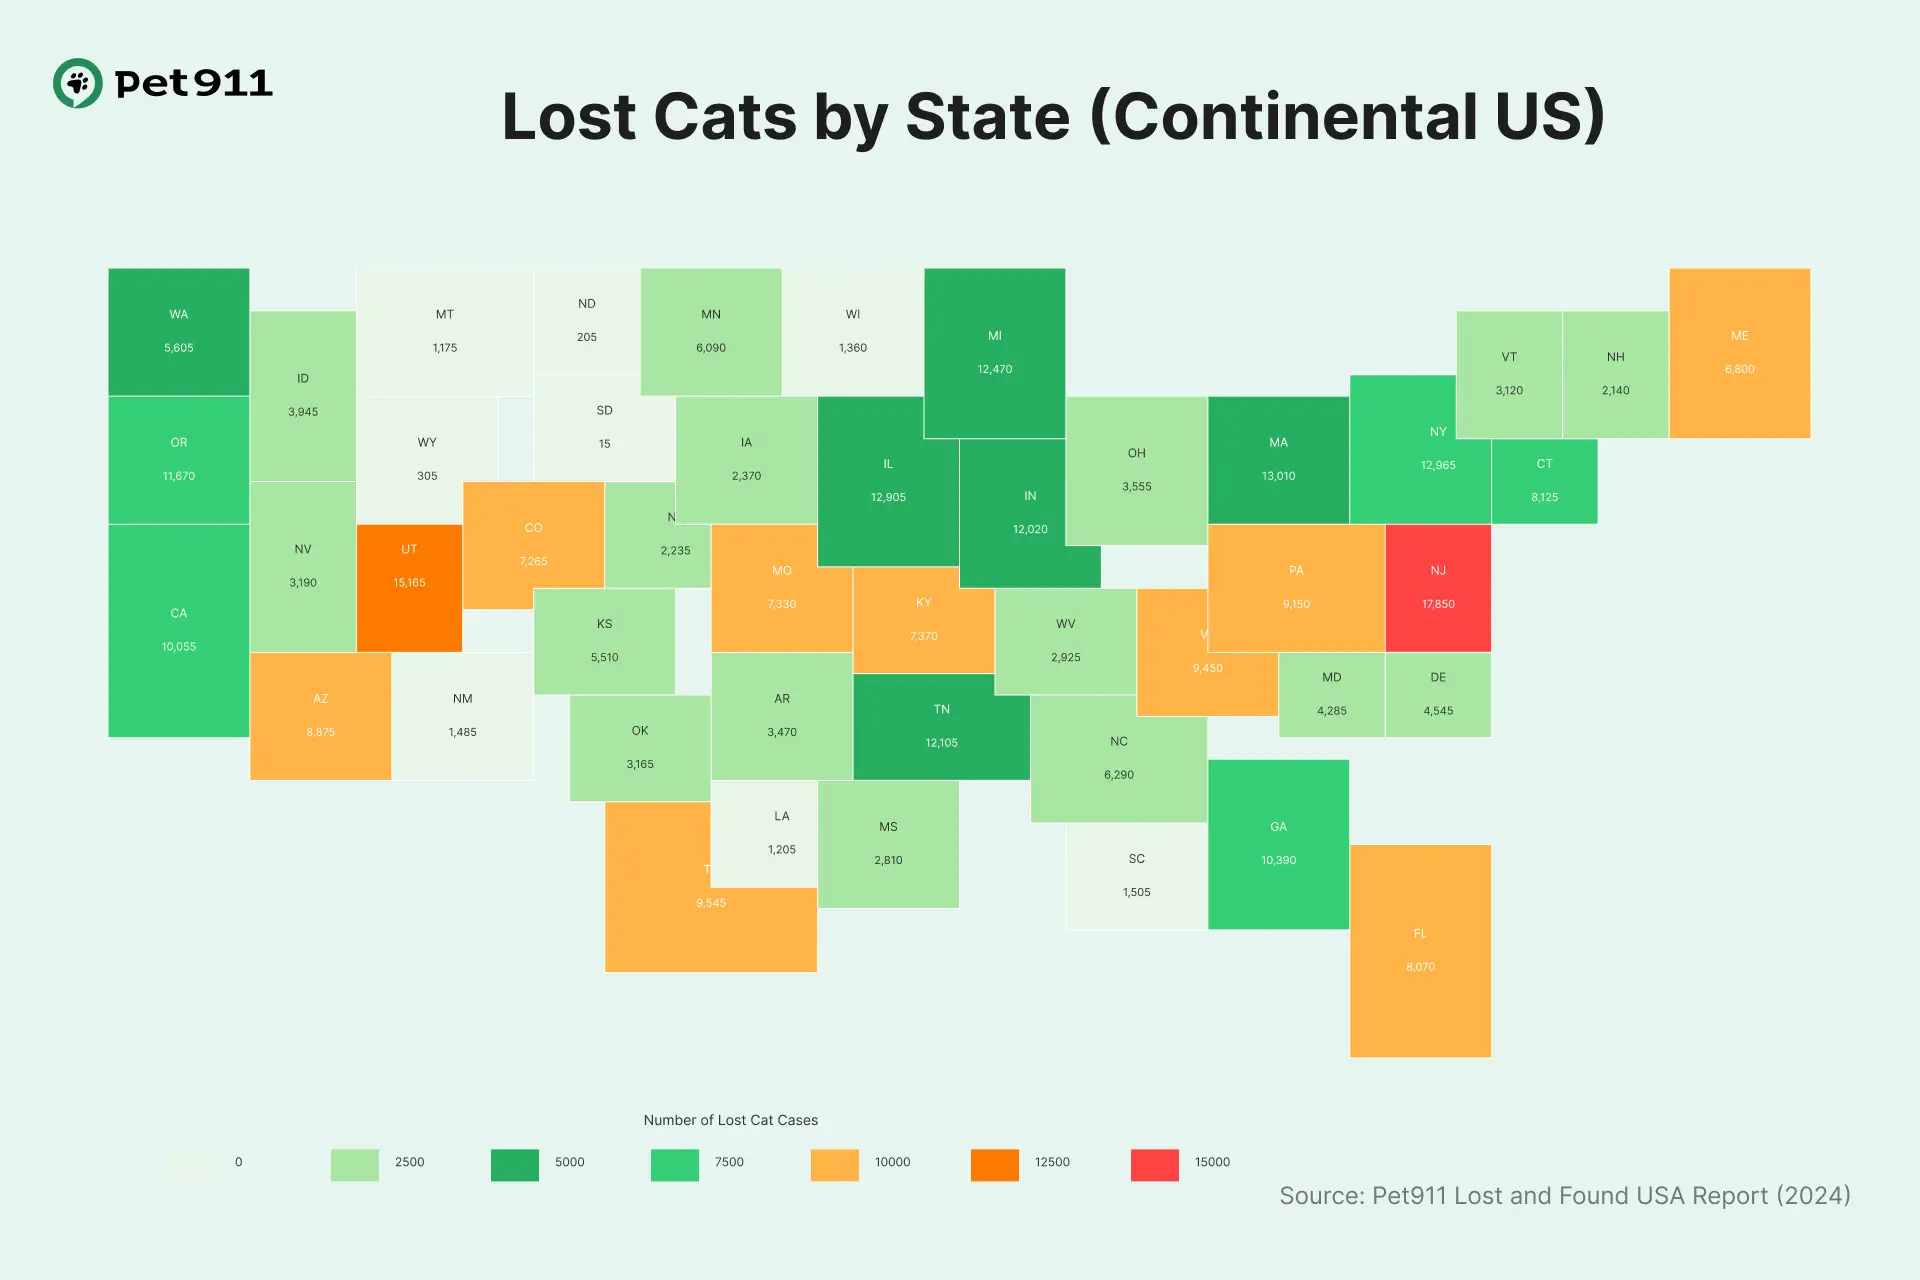
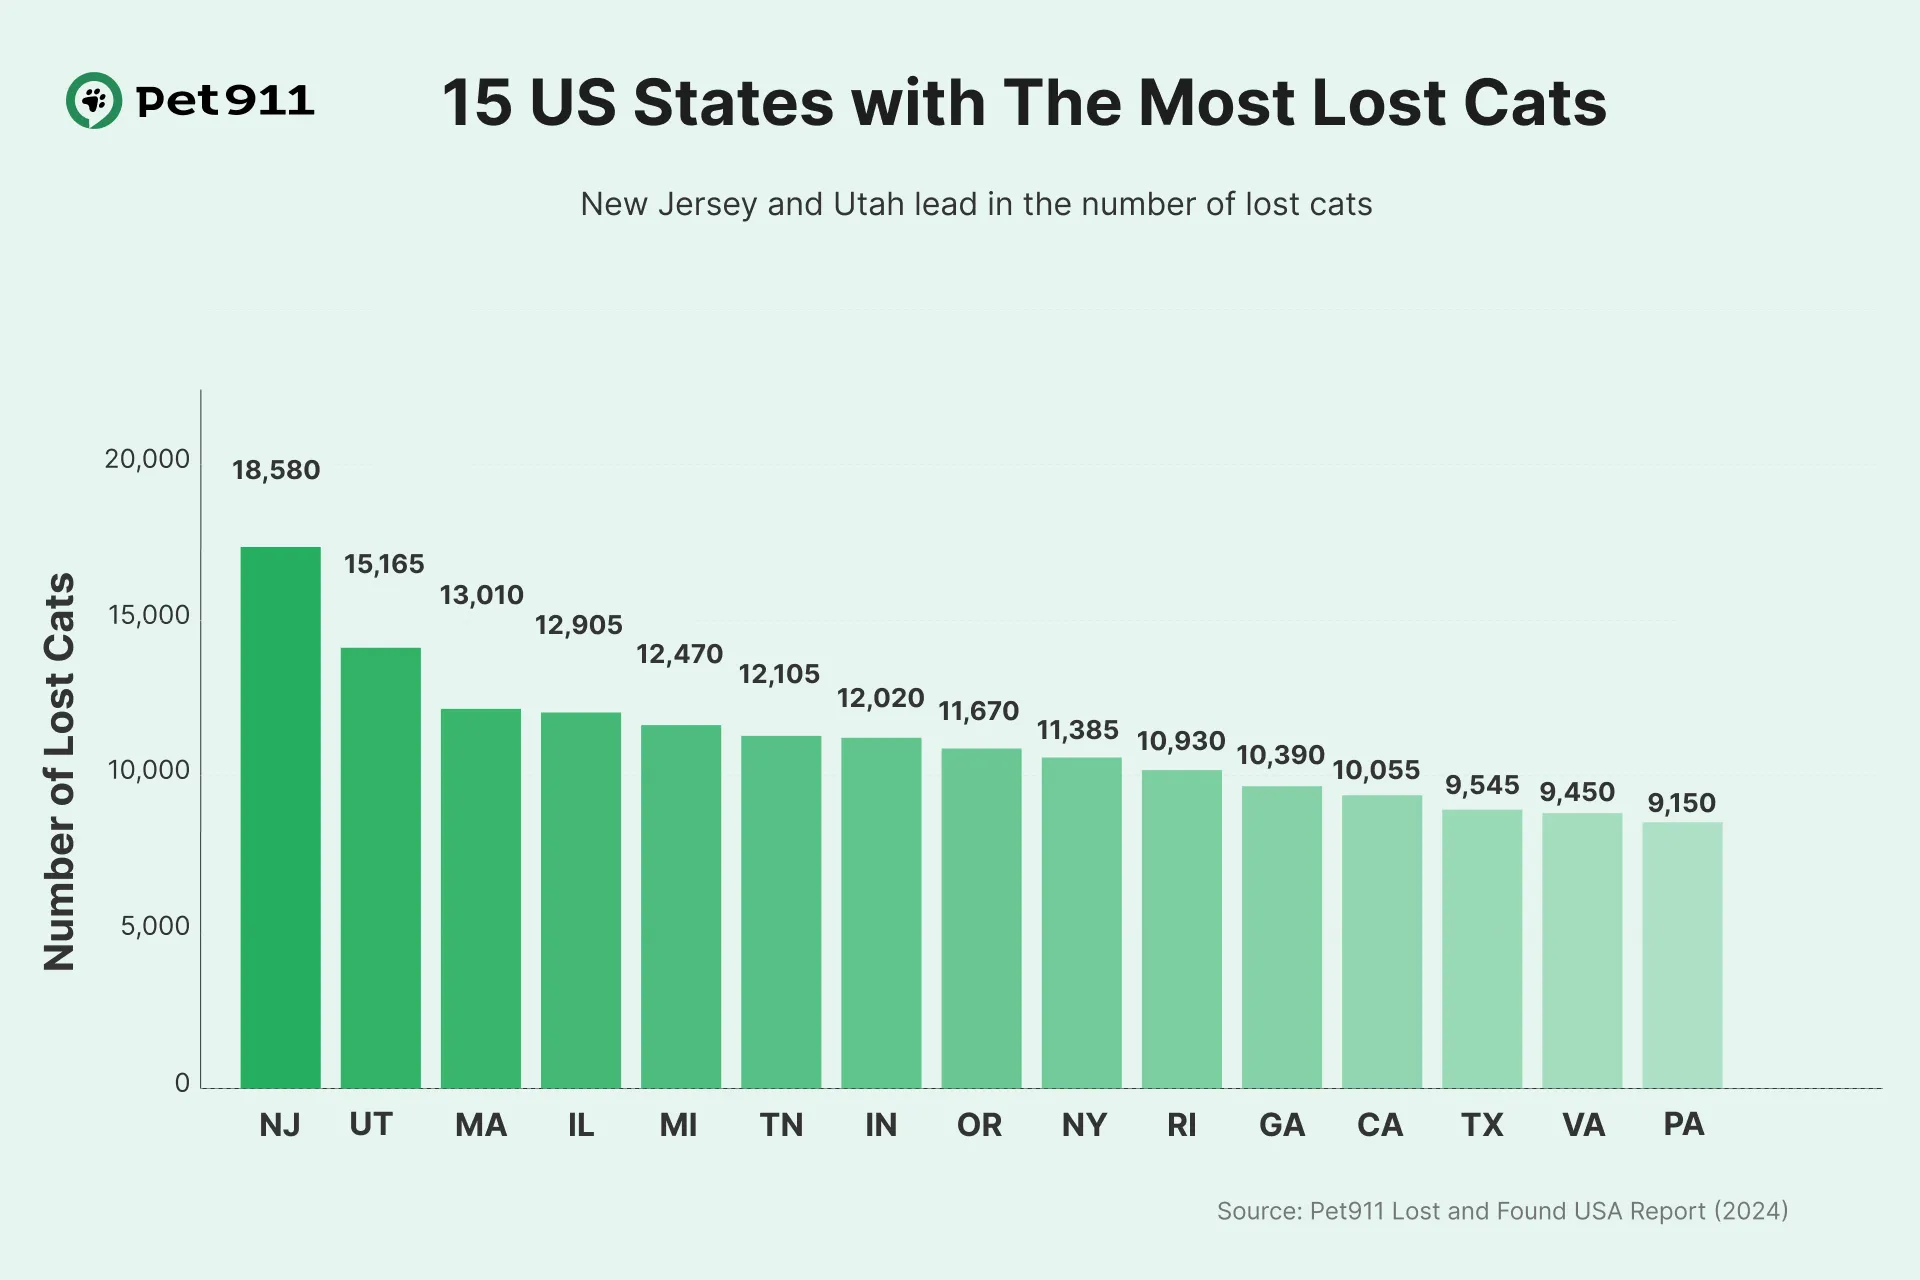
New Jersey leads with 18,580 cases of lost cats
We've also analyzed which states report the highest numbers of lost cats across the country, revealing some unexpected patterns.
New Jersey and Utah lead the nation with 18,580 and 15,165 missing cat cases respectively. Following closely behind are Massachusetts and Illinois, each reporting around 13,000 cases.
Particularly noteworthy is Tennessee, which ranks sixth for lost cats (12,105) while simultaneously holding the second position for lost dogs (58,035)—making it a state where pet owners should be especially vigilant.
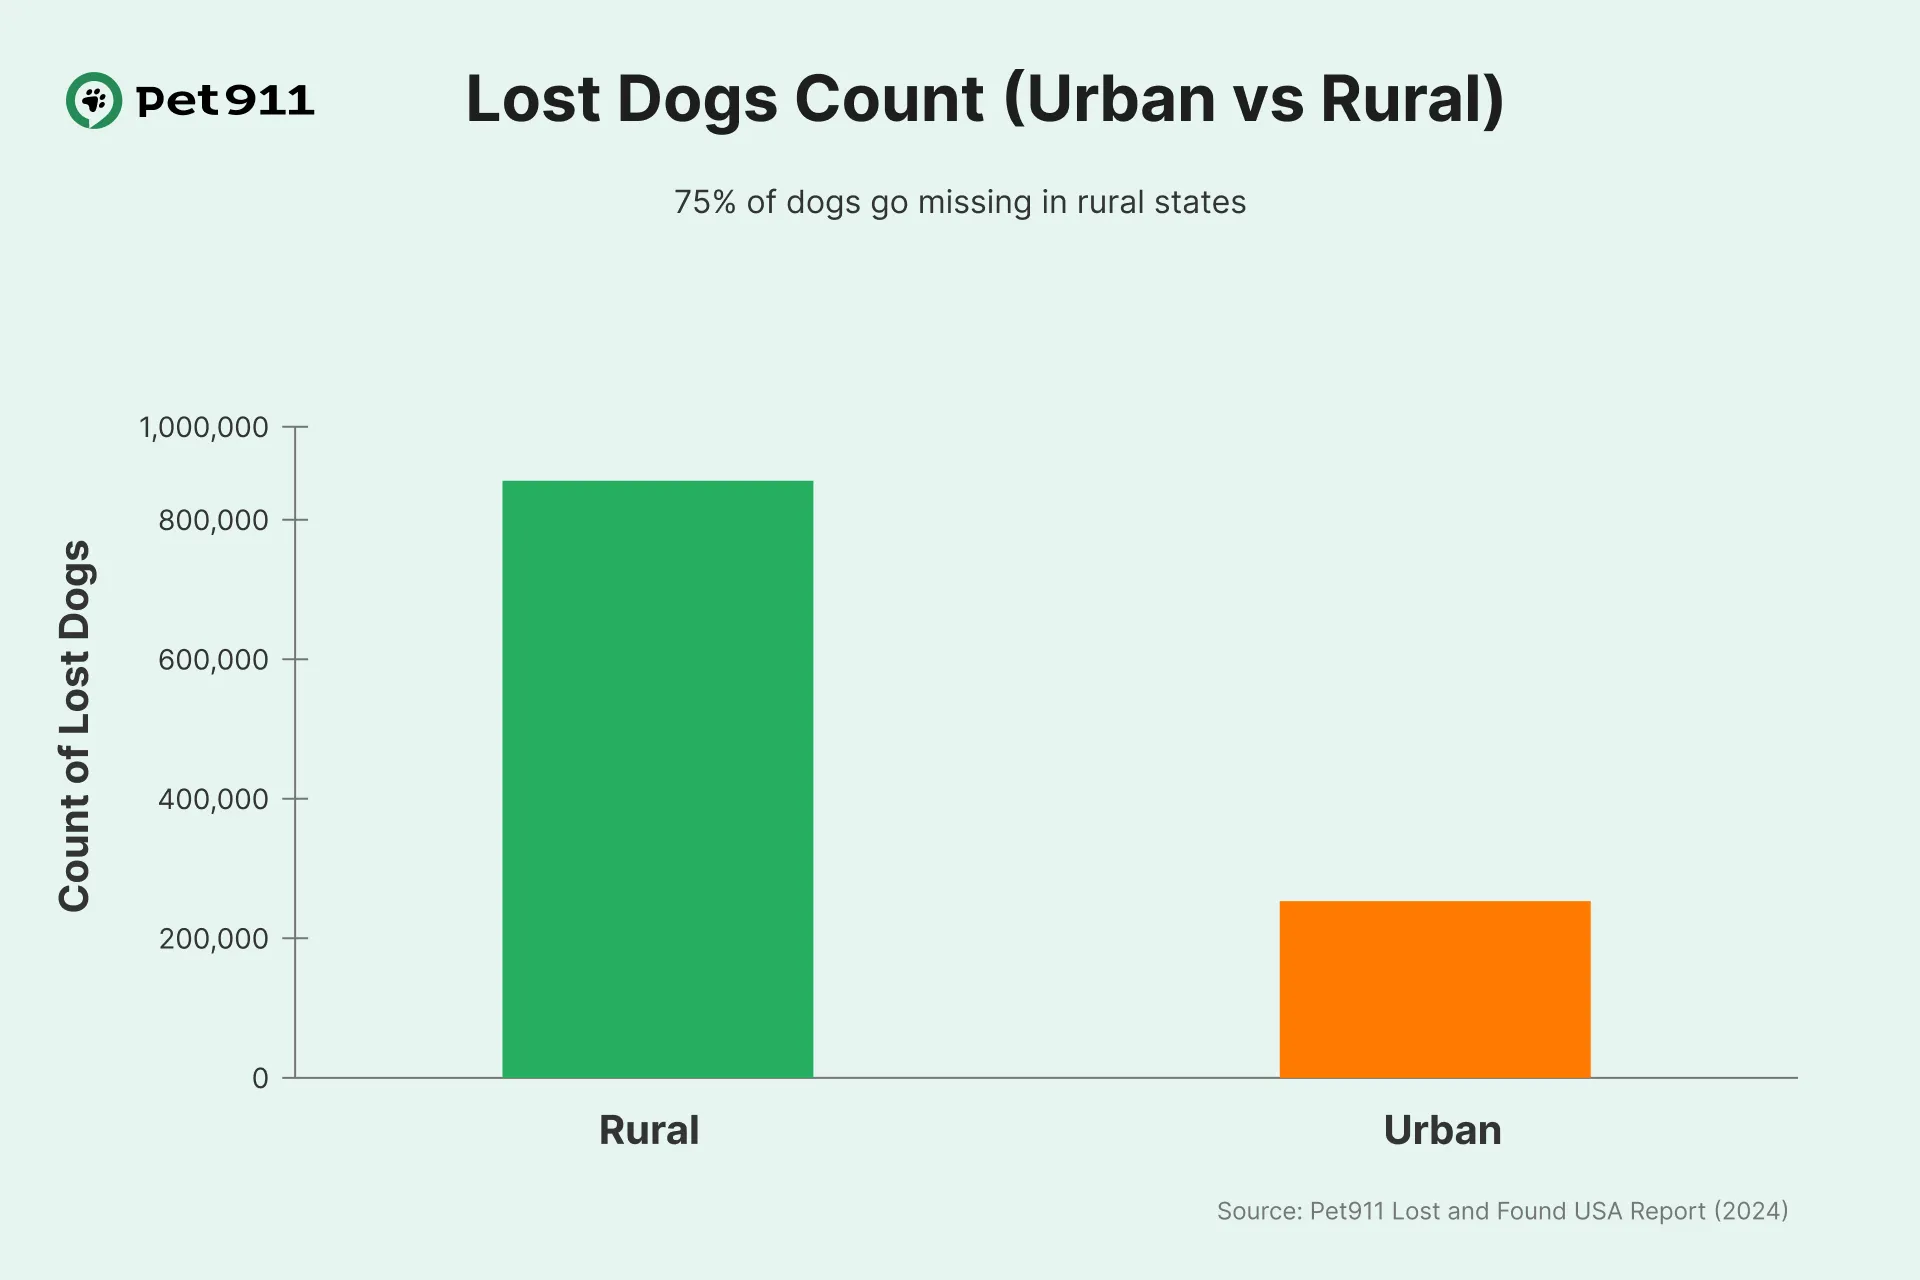
75% of dogs go missing in rural states
We also examined states with the lowest rates of lost pets. Comparing these regions with high-risk areas revealed a striking insight: in rural areas, dogs go missing three times more often than in urban settings.
An impressive 75% of all lost dog cases occur in rural states—a significant disparity that tells an important story about pet safety across different environments. While the days of cowboys and open ranges may be behind us, these vast, sparsely populated territories still present unique challenges for pet owners.
The expansive landscapes of rural America seem to entice dogs to venture farther from home in search of adventure. Unfortunately, when pets do go missing in these areas, the sheer size of the search territory makes recovery particularly challenging, even for the most dedicated owners.
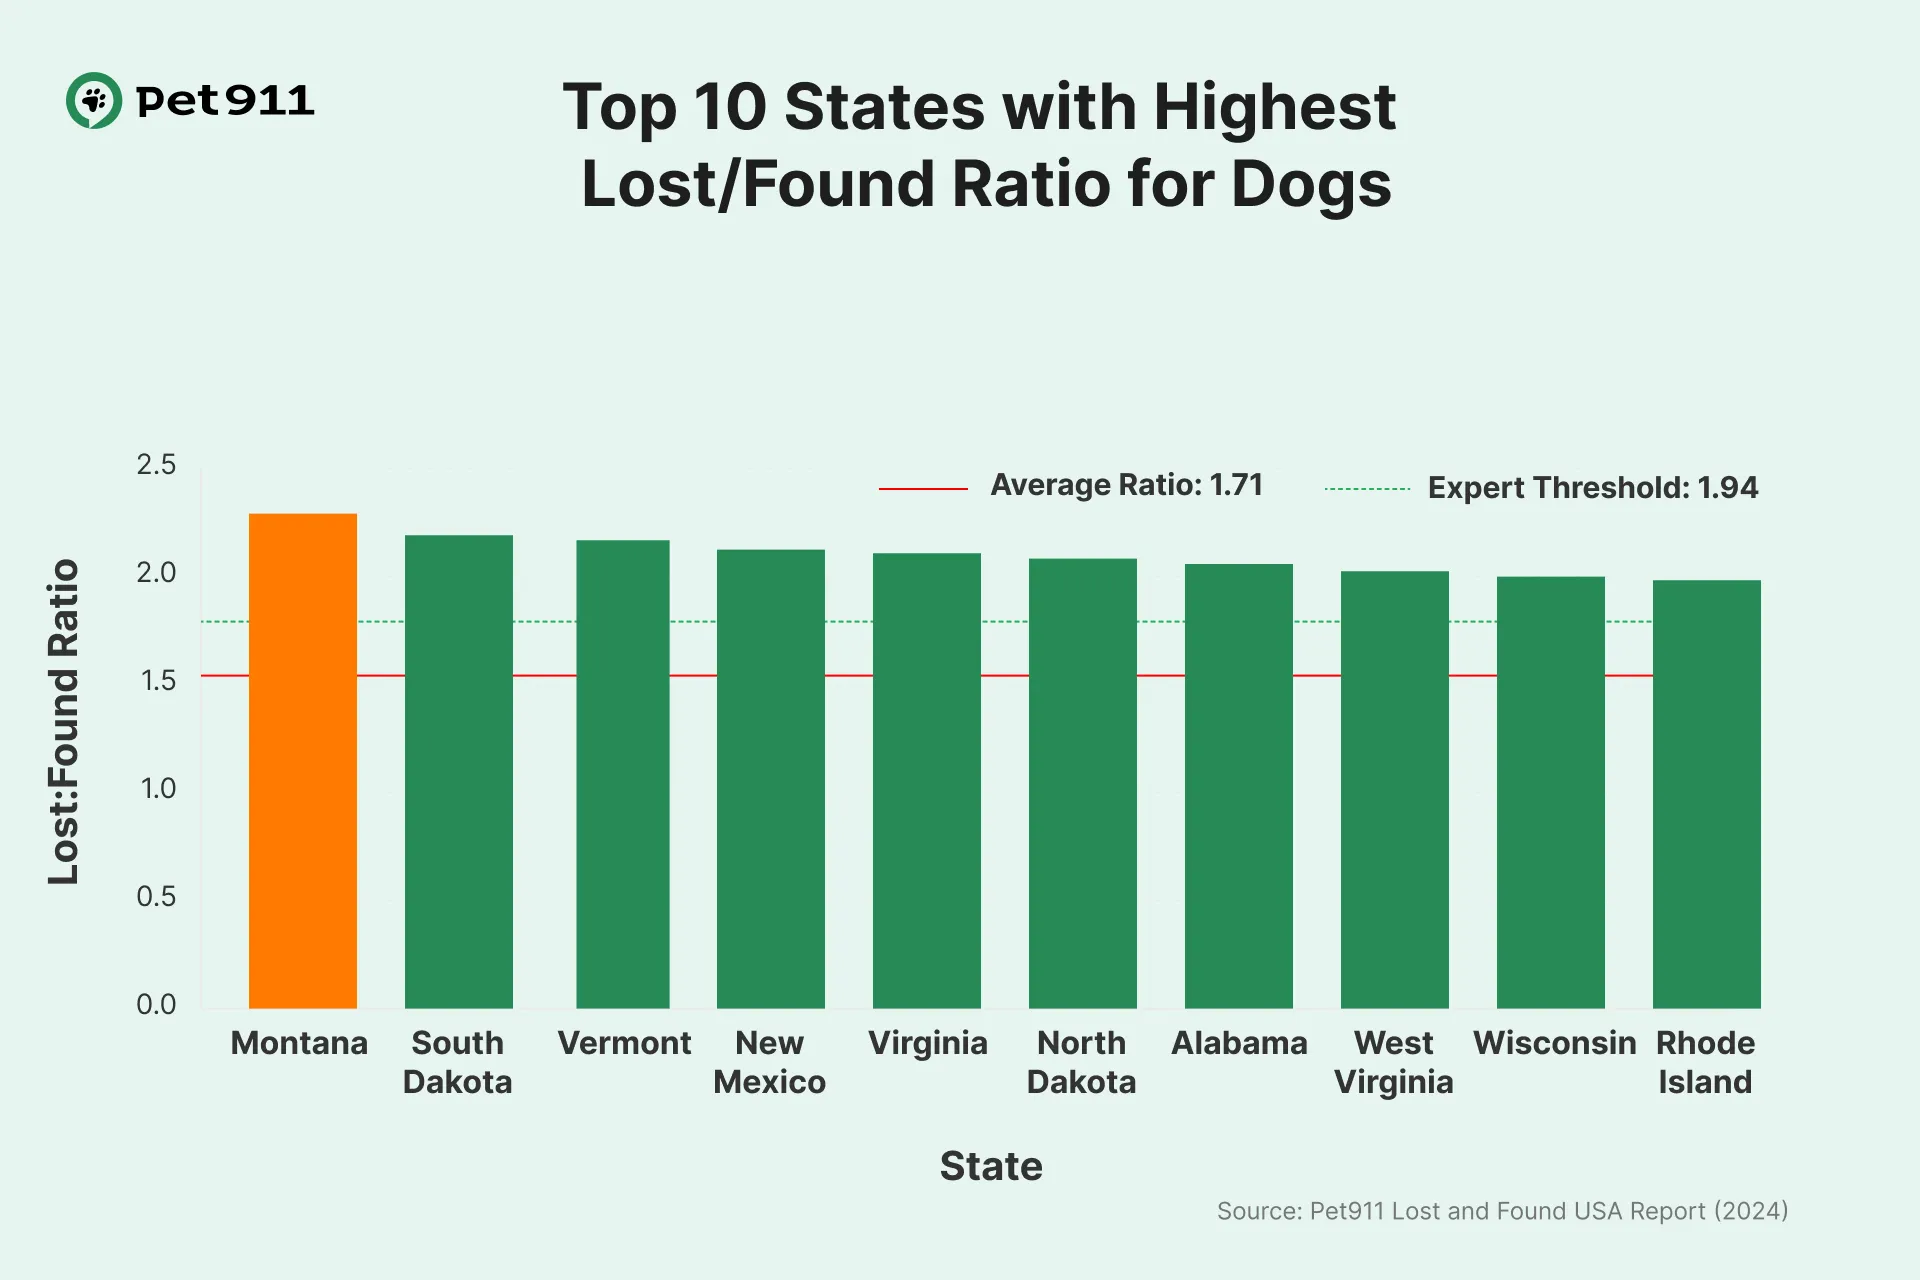
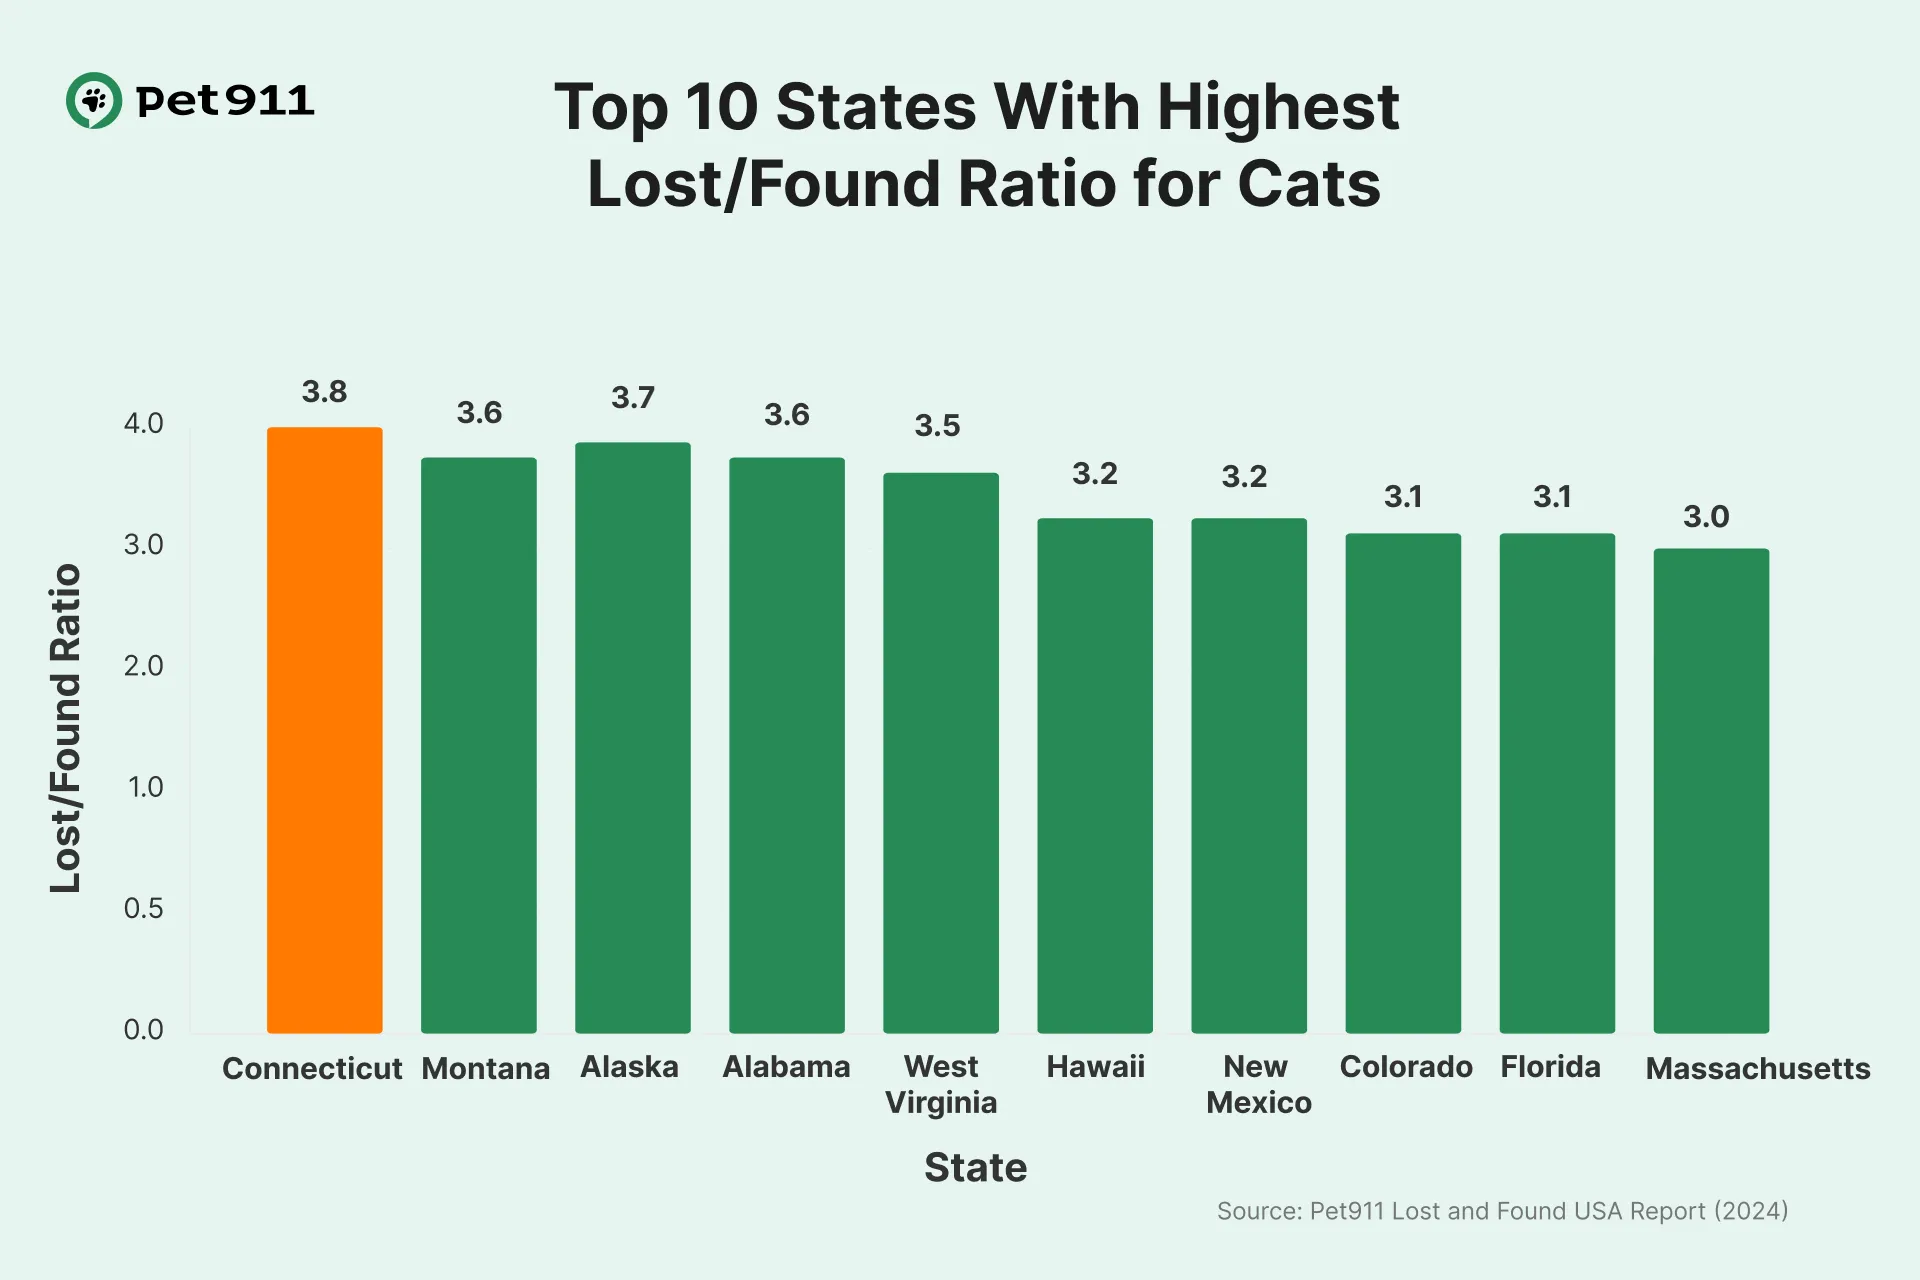
Montana, Connecticut and South Dacota are the states with the lowest volunteer community engagement
These charts illustrate the ratio of lost pets to found ones across different states. They reflect the volume of listings published in each region, and interestingly, states with the highest ratios on these parameters actually indicate areas with lower community engagement.
For the dog chart specifically, the elevated ratios may correlate with higher populations of stray dogs. More broadly, though, states showing the highest lost-to-found ratios typically demonstrate less community involvement in searching for lost pets and have fewer dedicated animal volunteers actively participating in recovery efforts.
By identifying these patterns, we can better target our educational initiatives and community-building efforts where they're needed most. The data doesn't just show us where pets are going missing—it shows us where Pet911 can make the greatest difference by mobilizing more volunteers and raising awareness about effective search strategies.
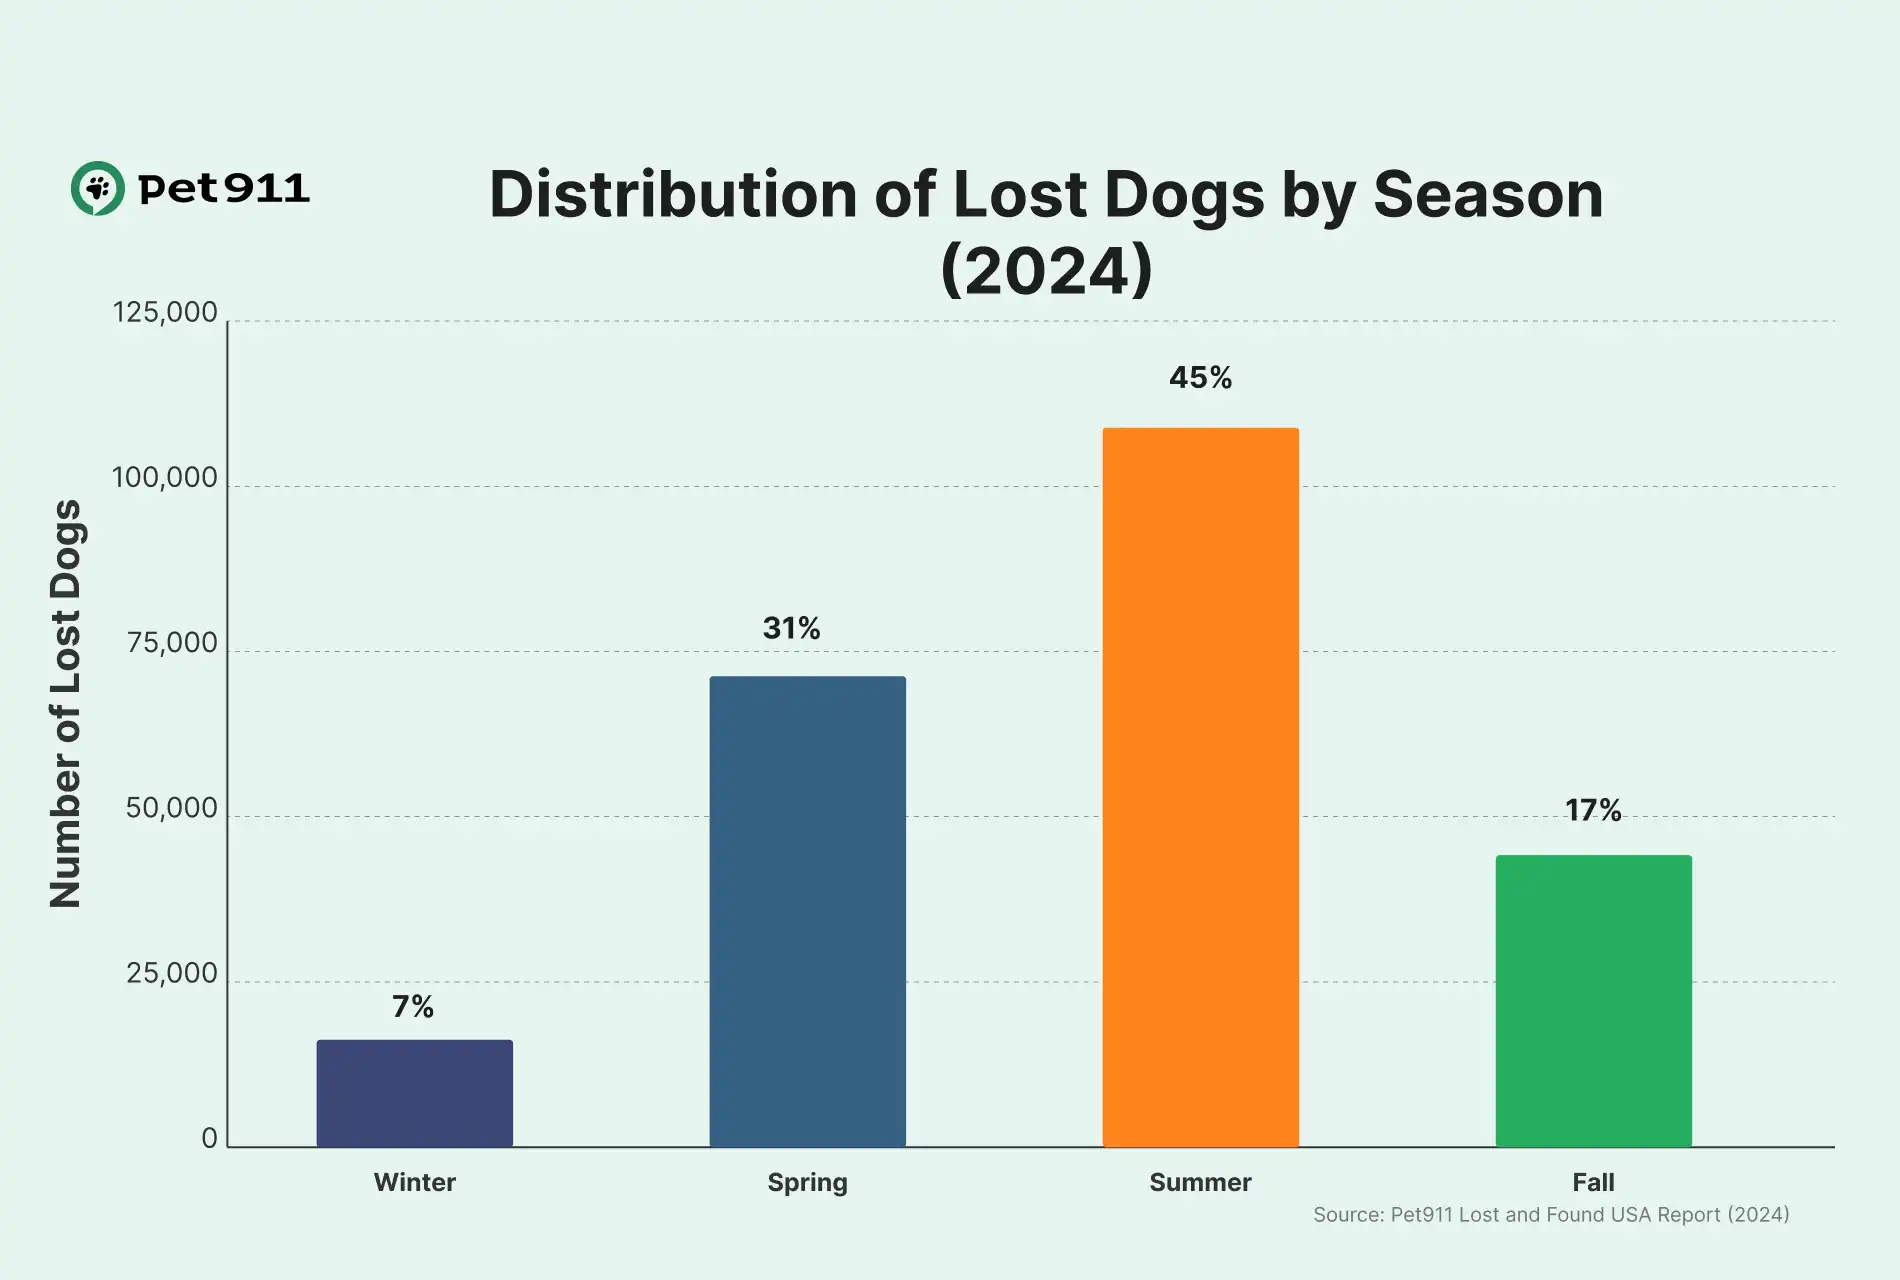
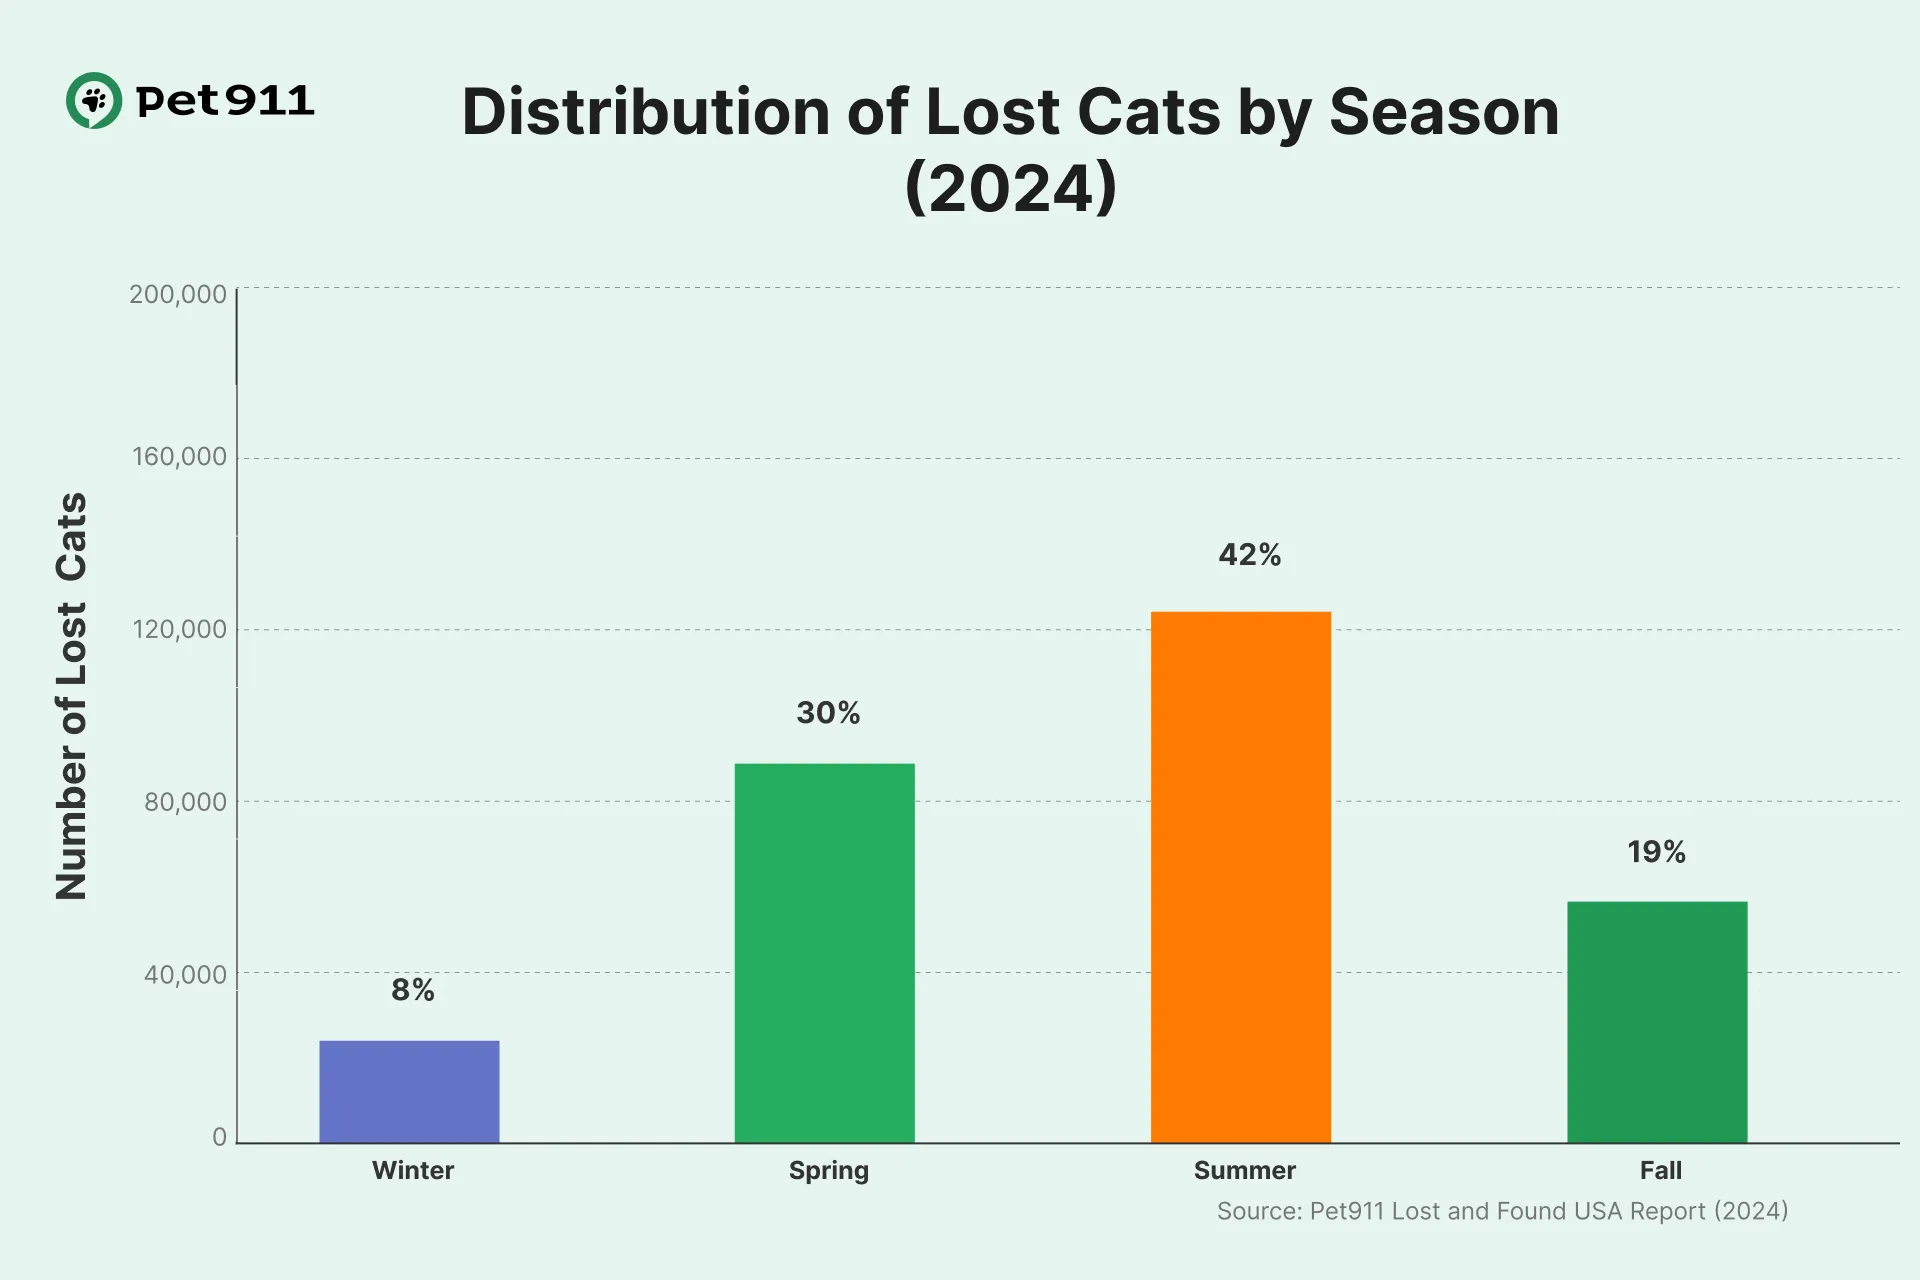
Seasonal Trends: When Pets Go Missing
July stands as the most dangerous month for pets, with over 40% of all pet losses occurring during this peak summer period. The seasonal trends we observe in the United States mirror patterns in other countries where Pet911 operates: summer consistently proves to be the most hazardous time for pet disappearances.
Our data shows that:
- 45% of dogs and 40% of cats go missing during summer months
- The second most dangerous season is spring, when 31% of dogs and 30% of cats disappear from their homes
- Winter accounts for only 7% of dog losses and 8% of cat losses nationwide
The correlation is clear—the colder it is outside, the less likely animals are to venture away from the warmth and comfort of home.
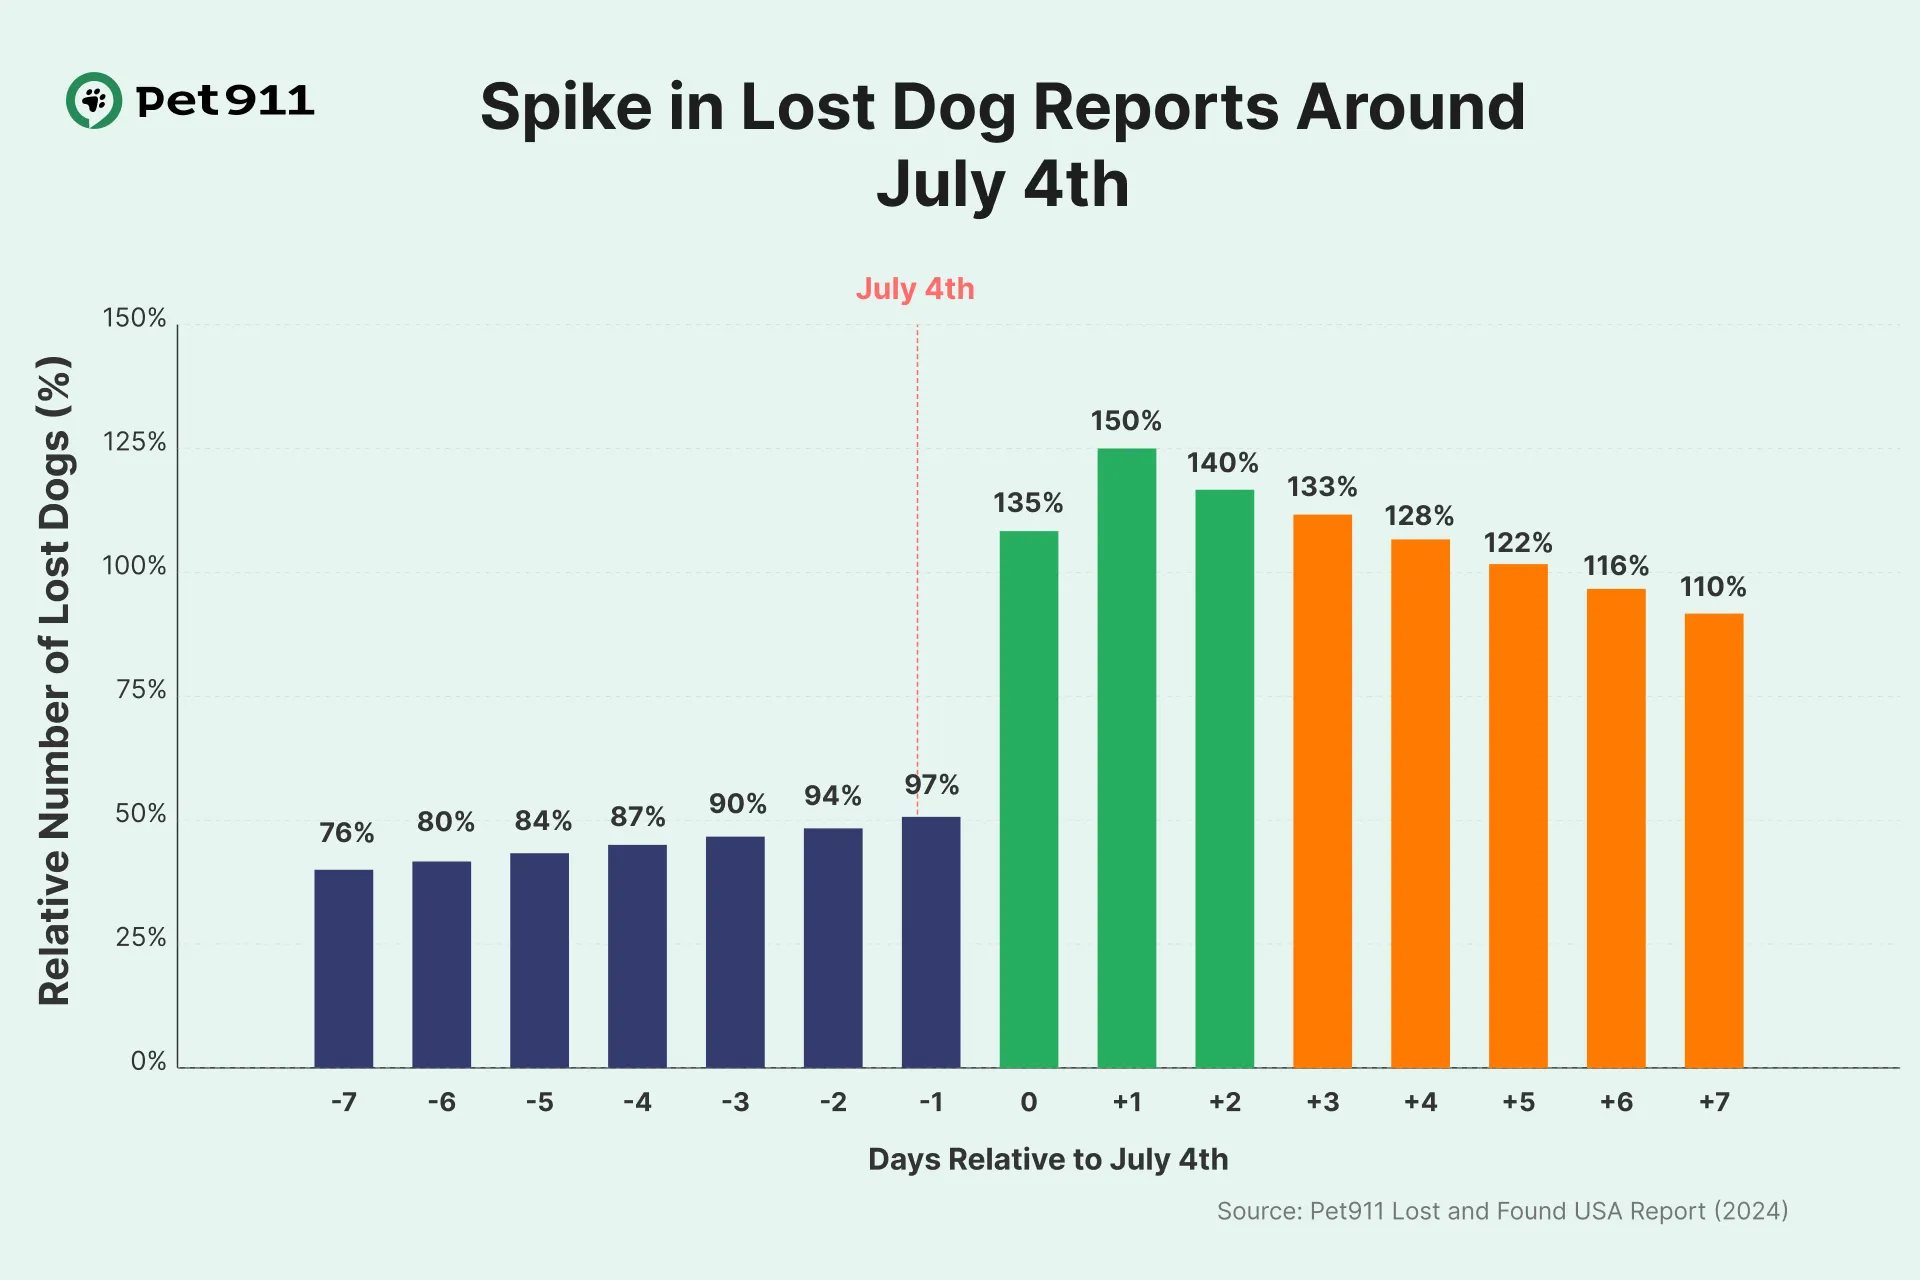
The Number of Lost Dog Reports Increases by 31% on July 4th.
Our data reveals a substantial 31% increase in lost dog reports on July 4th compared to surrounding days. This significant spike isn't just a statistic—it represents thousands of frightened family members racing away from their homes and loved ones.
The connection between Independence Day celebrations and missing pets becomes clear when we examine the circumstances:
- Fireworks displays create terrifying sounds and lights that trigger panic responses in even normally calm dogs
- Outdoor gatherings increase the likelihood of momentarily unattended doors or gates
- Disrupted household routines mean pets may receive less supervision during critical moments
- Heightened environmental stress affects dogs' behavior and decision-making
Breed Analysis: Which Pets Go Missing Most Often?
When we exclude missing breed data, we get a clearer picture of which breeds are most commonly reported as lost.
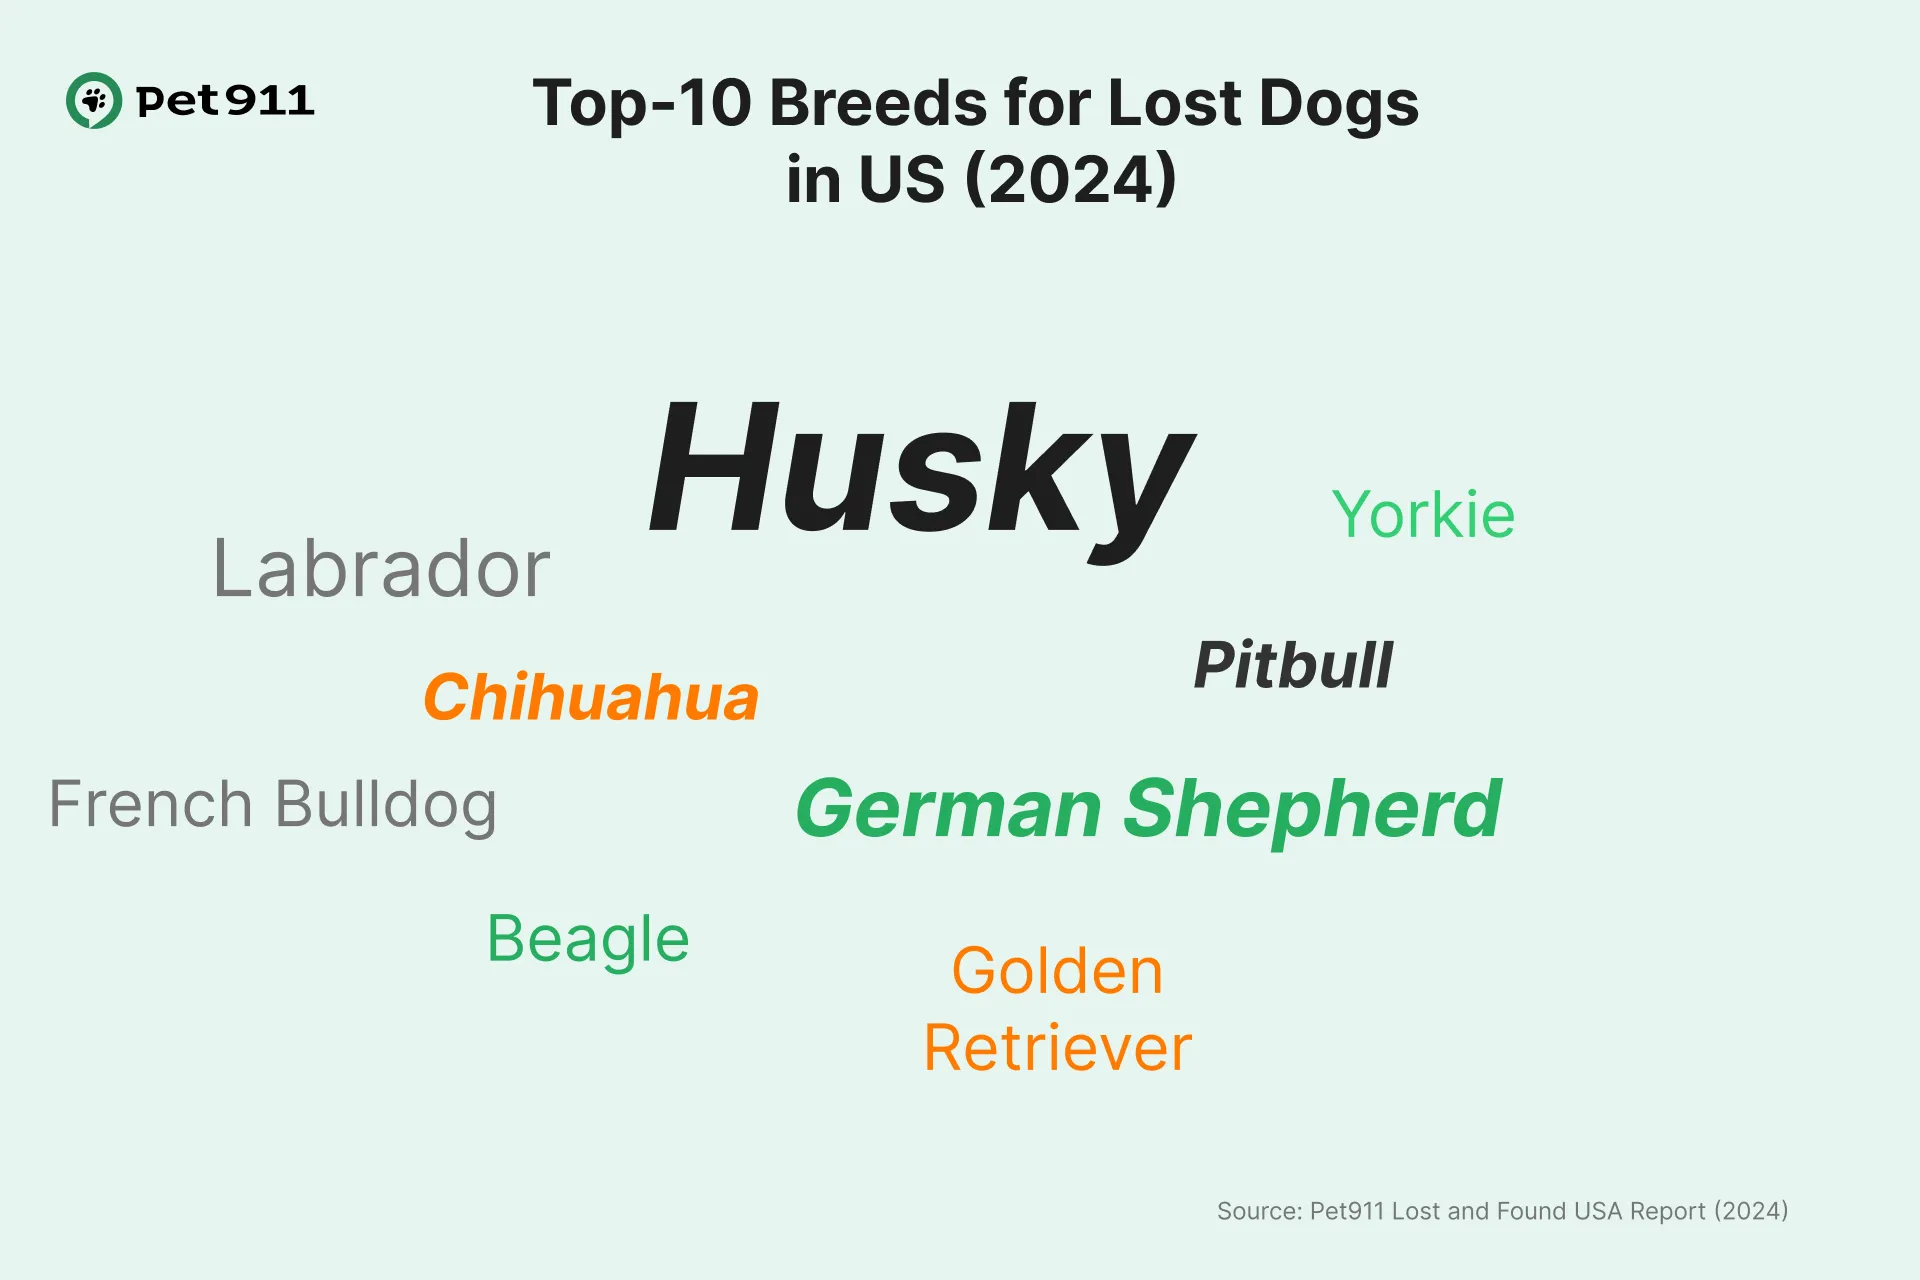
Dog Breeds
Huskies are the most frequently lost (7%), and this is quite expected. Firstly, Huskies are among the top 10 most popular dog breeds in the country. Secondly, they have a genetically strong hunting instinct, are naturally free-spirited, and are difficult to train.
What's much more surprising: Chihuahuas come in second (6%). They are also among the world's top 10 most popular breeds, but they have a very different personality—they are attached to their owners and don't like being alone.
The top five lost dog breeds:
- Huskies (7%)
- Chihuahuas (6%)
- German Shepherds (5%)
- Pitbulls (4%)
- Labradors (3%)
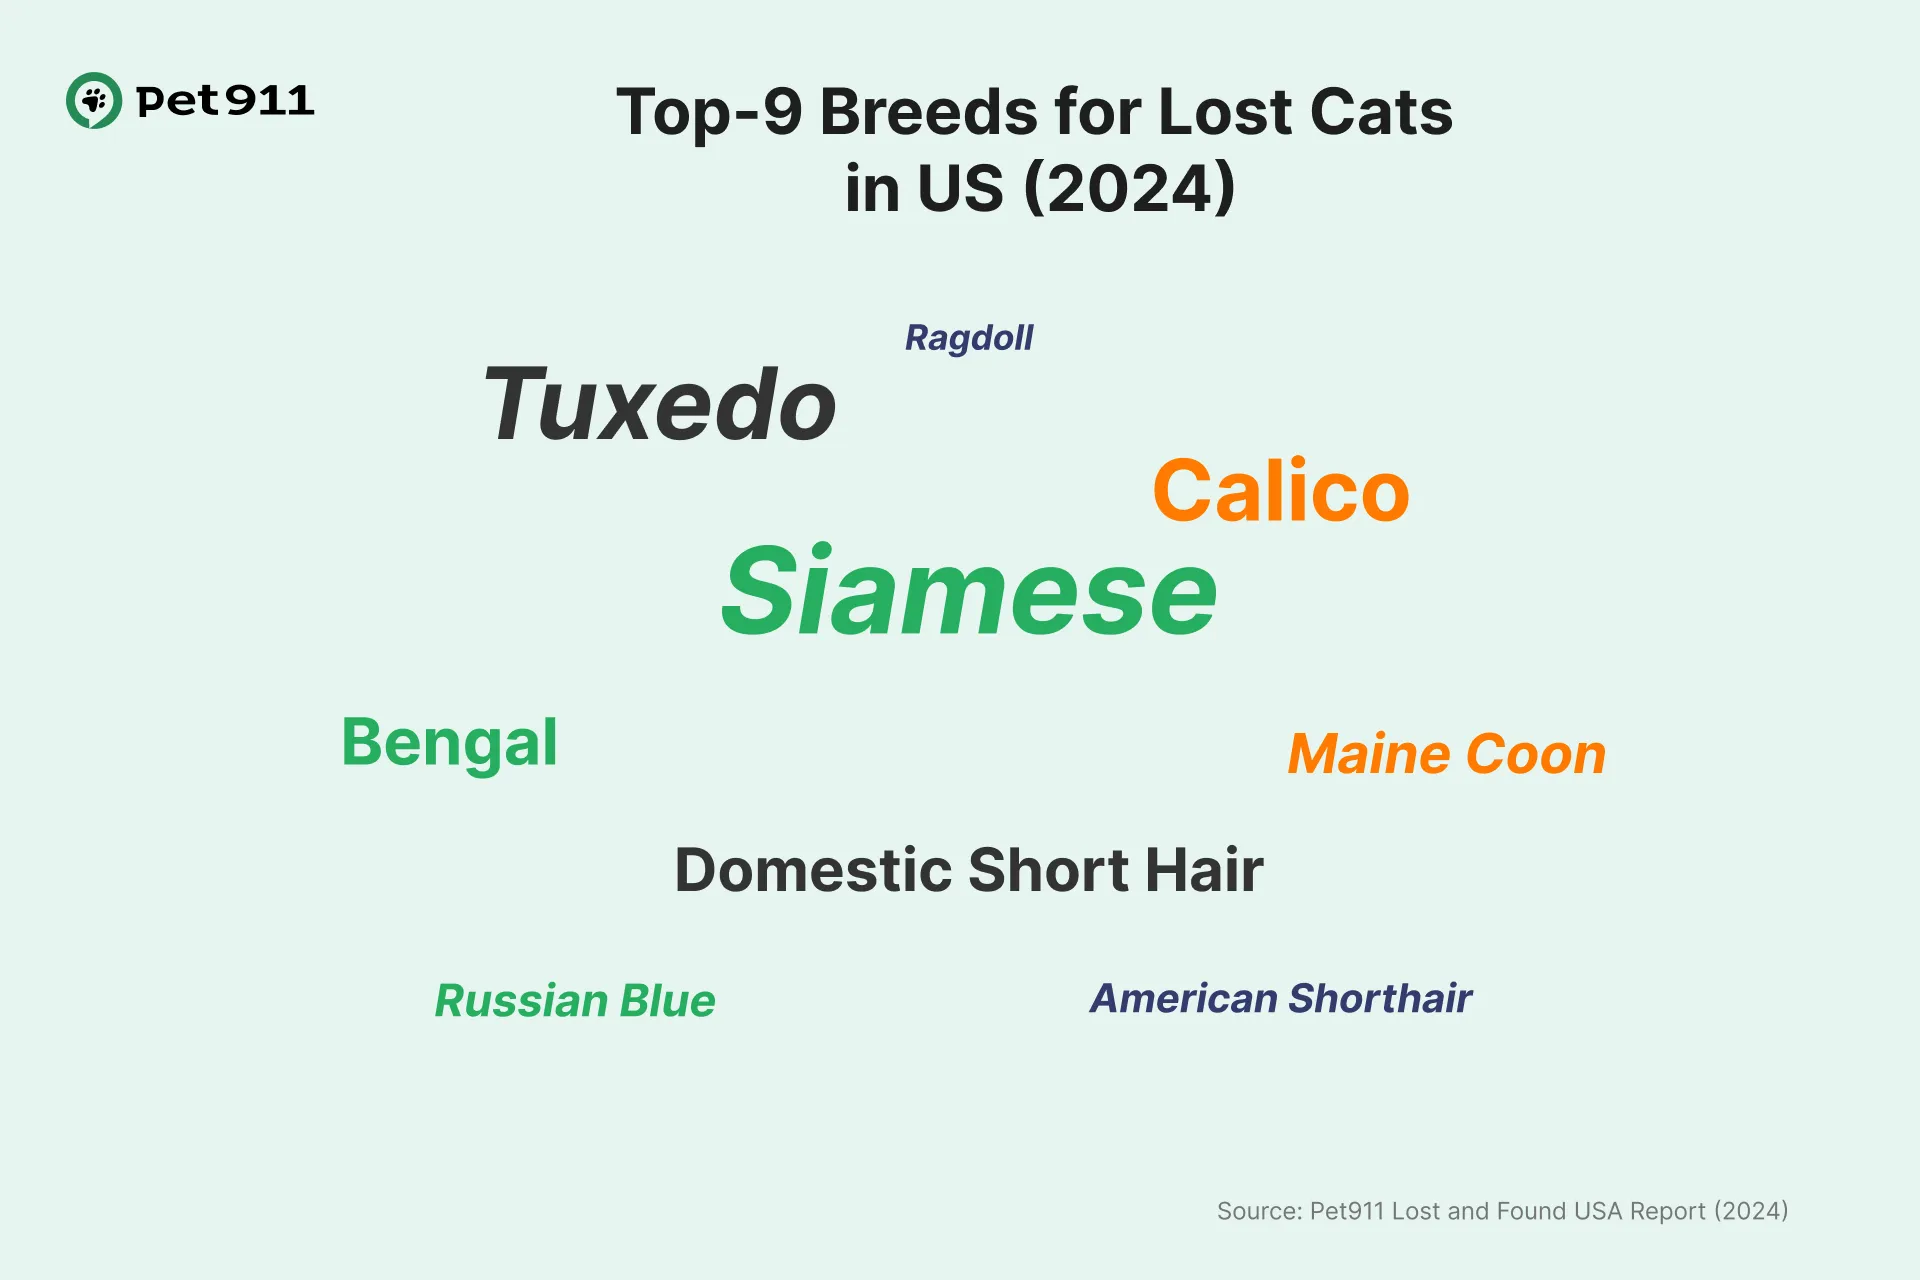
Cat Breeds
For cats, our data shows Siamese cats lead the lost pet reports at 8%, followed by Tuxedo cats at 7.7%. Bengal cats, despite being less common in the general population, appear frequently in lost cat reports.
Interestingly, almost half (48%) of all lost cats fall into the "Other" category, indicating a wide diversity of breeds beyond the top categories shown.
Gender and Temporal Patterns
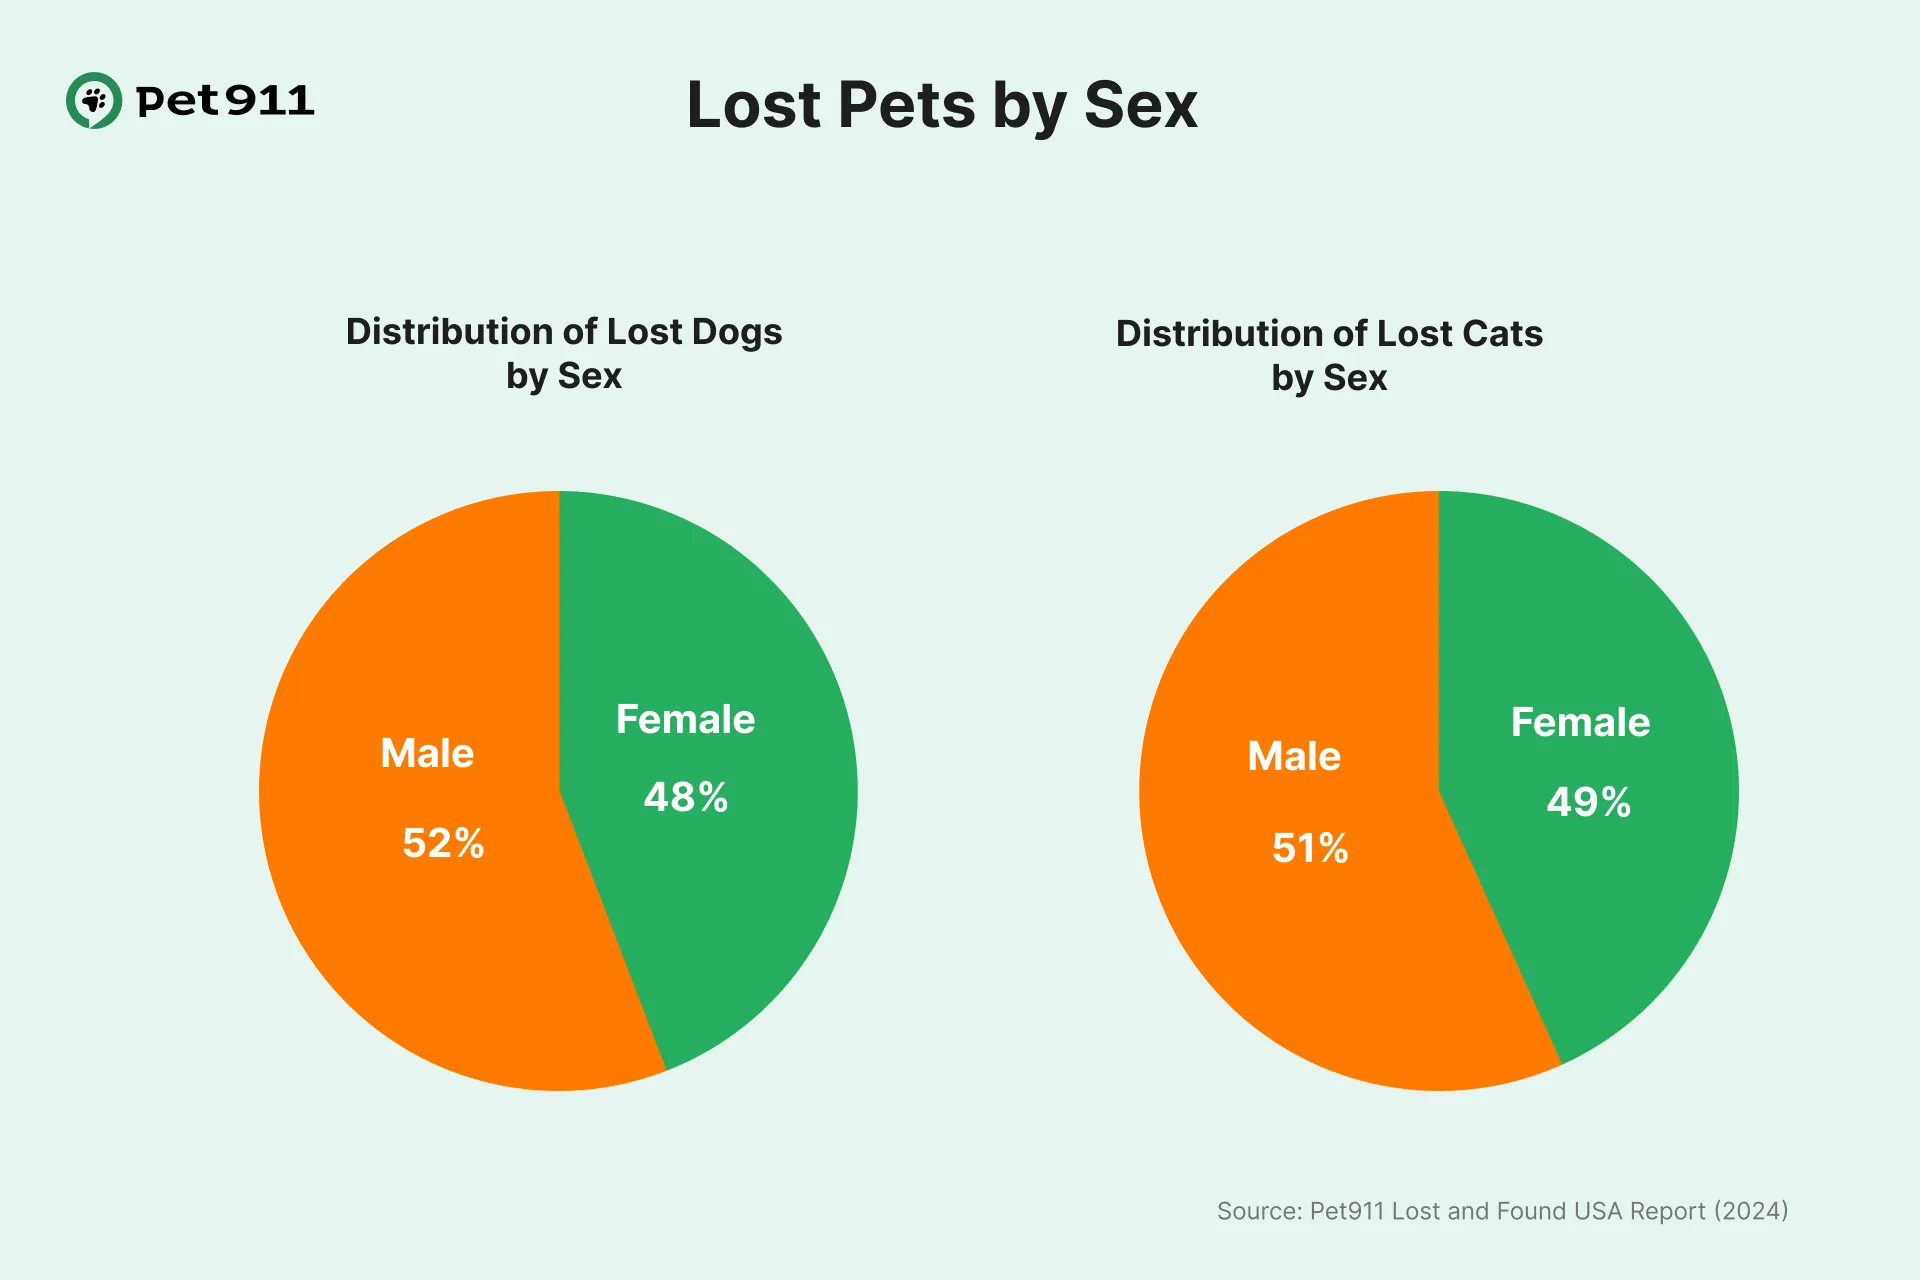
Gender doesn't matter! Boys and girls go missing equally
The data shows that among lost dogs with recorded sex information:
- 52% are male
- 48% are female
We see nearly identical proportions with cats:
- 51% male
- 49% female
These findings suggest that an animal's sex has minimal impact on the likelihood of it going missing. This helps dispel the common misconception that male pets are significantly more prone to wandering or escaping from home.
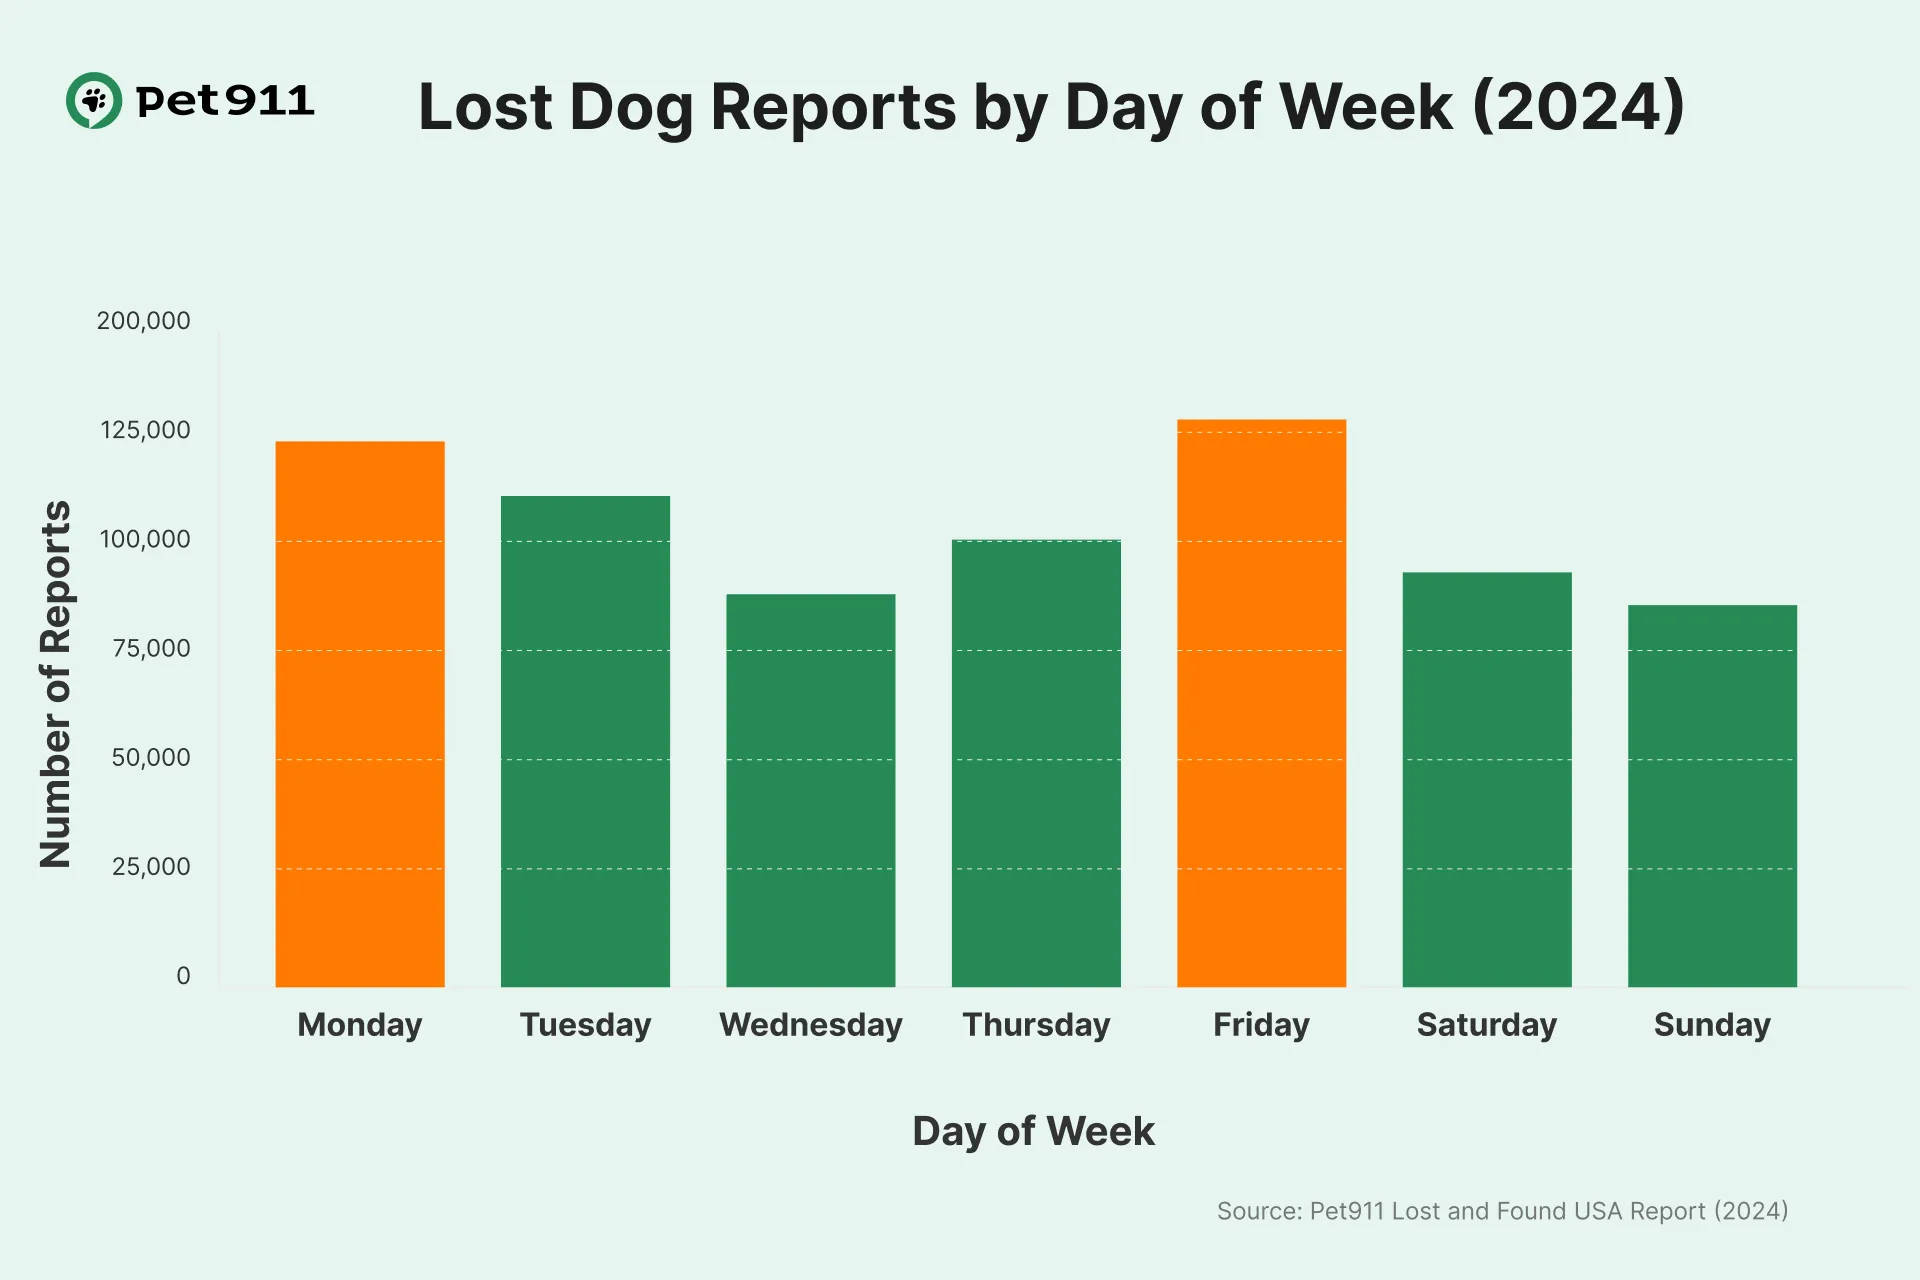
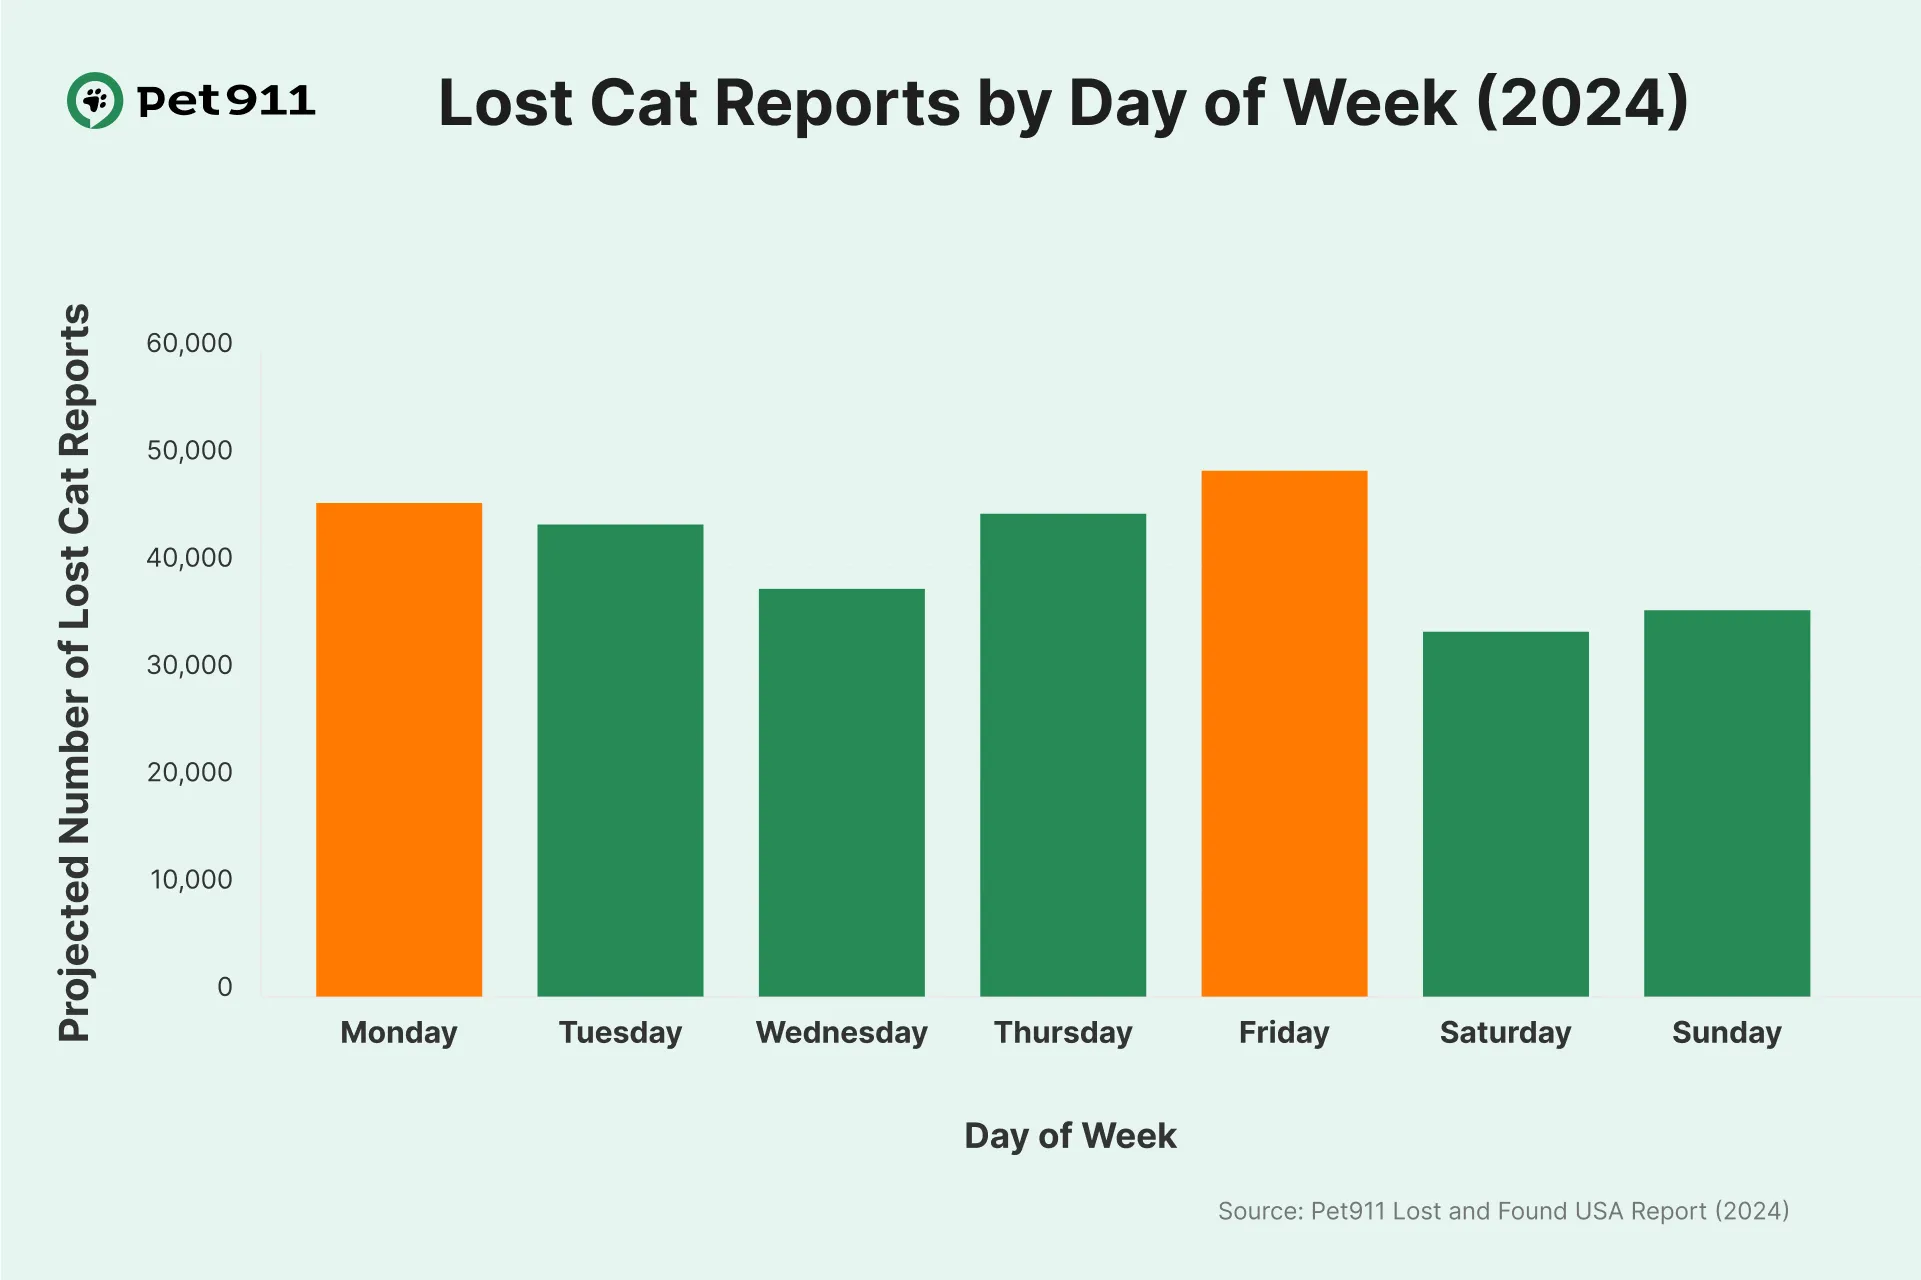
Pets are most likely to go missing on Fridays, with the number of lost pet reports increasing on that day.
Looking at weekly patterns reveals a surprising trend: Friday and Monday are the days when most found and lost pet listings are posted online.
This trend is almost certainly linked to pet owner behavior rather than any patterns in the animals themselves. It may be because that people have more opportunity to create online posts at the beginning and end of the work week, when they're likely to be at a computer for work.
During weekends, people might prioritize different activities and, if a pet goes missing, dedicate this time to physical searches in their neighborhoods rather than creating online listings.
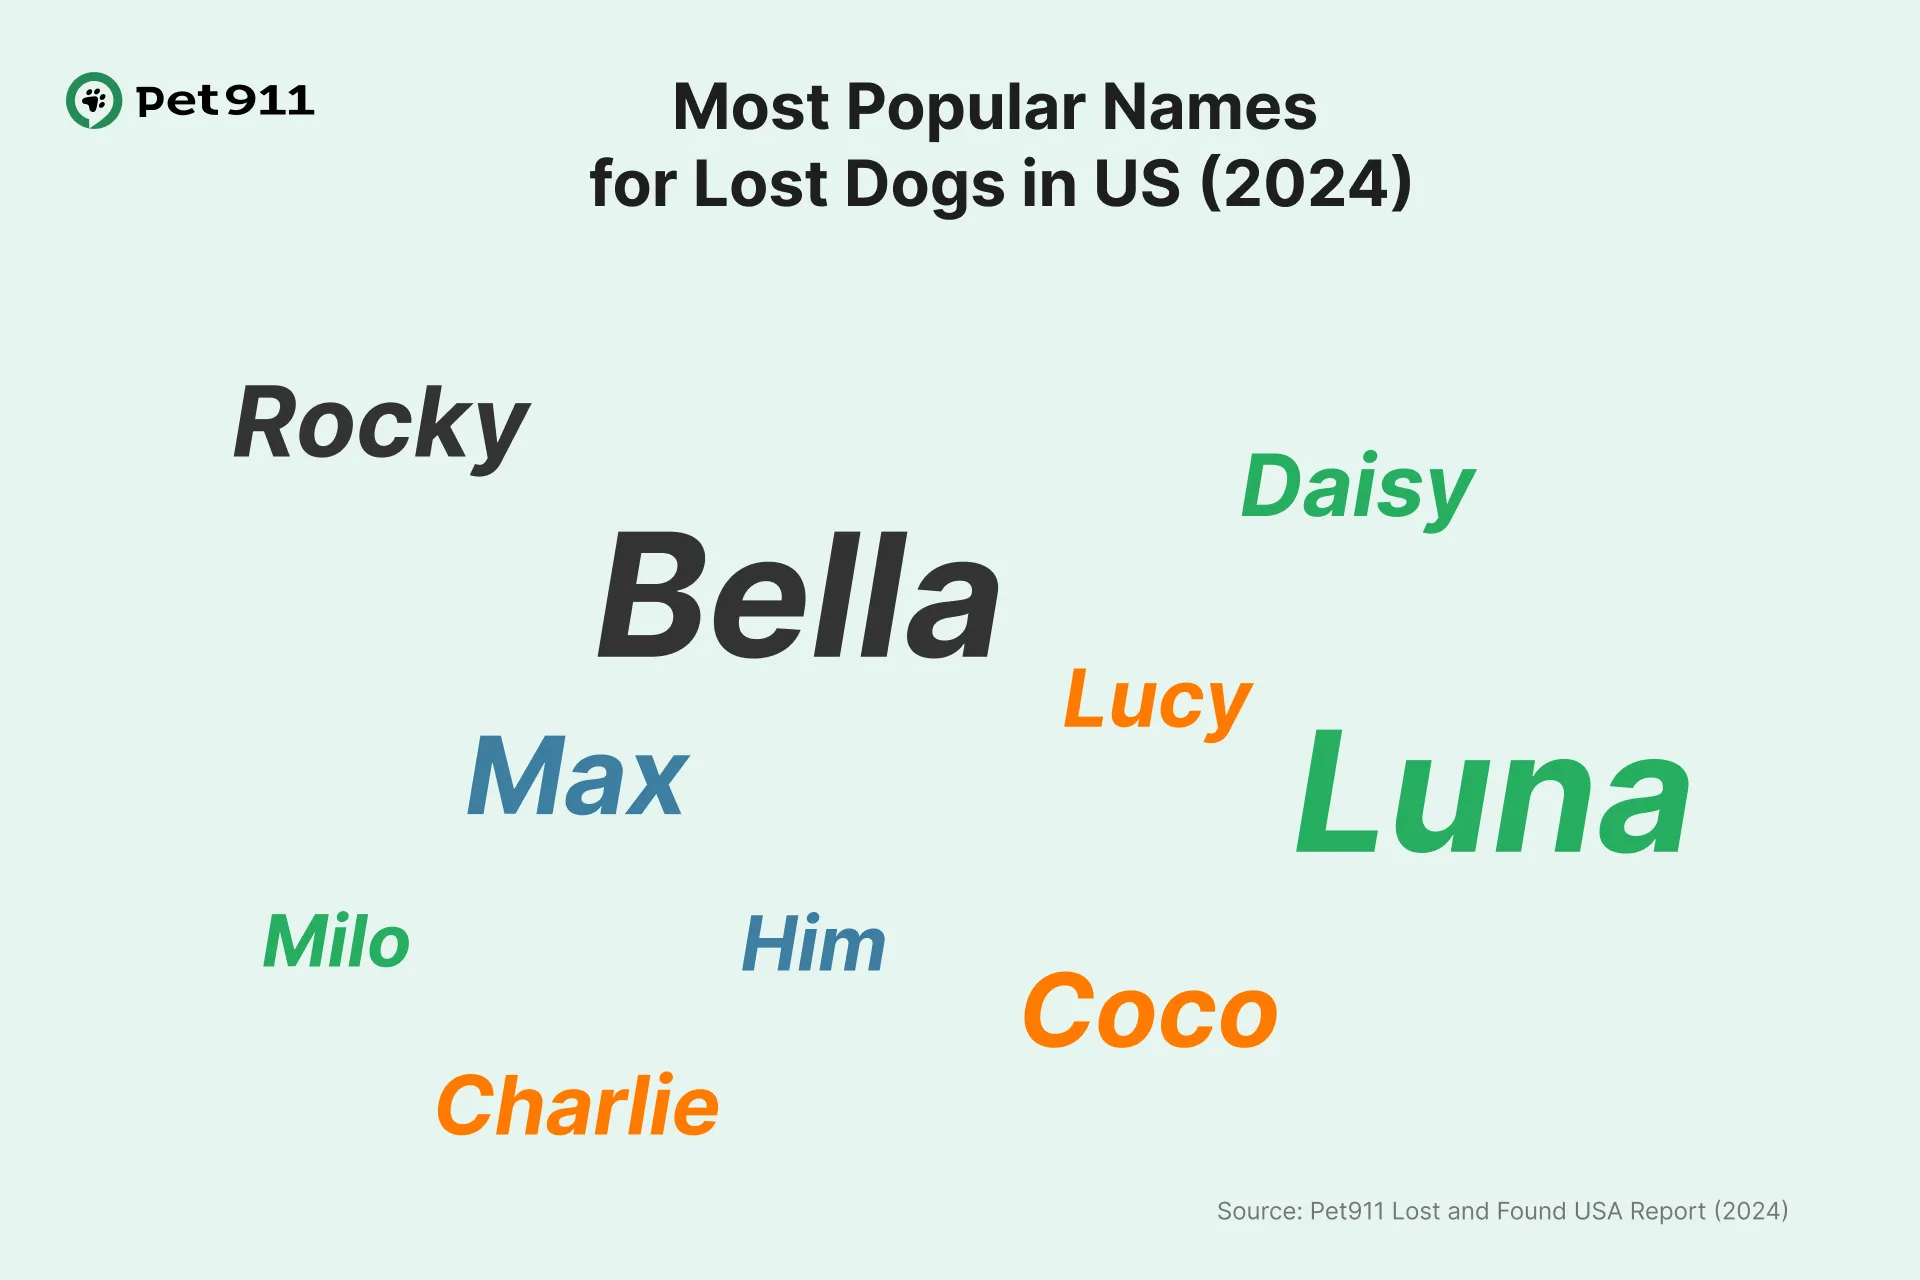
Bella and Luna are the most popular names for lost pets
Don't worry—we're not suggesting that naming your kitten "Luna" will guarantee it goes missing! This section of our report is more for entertainment value, as it simply reflects the overall picture of the most popular pet names in the United States.
The most popular names for lost dogs include:
- Bella
- Luna
- Max
- Coco
- Rocky
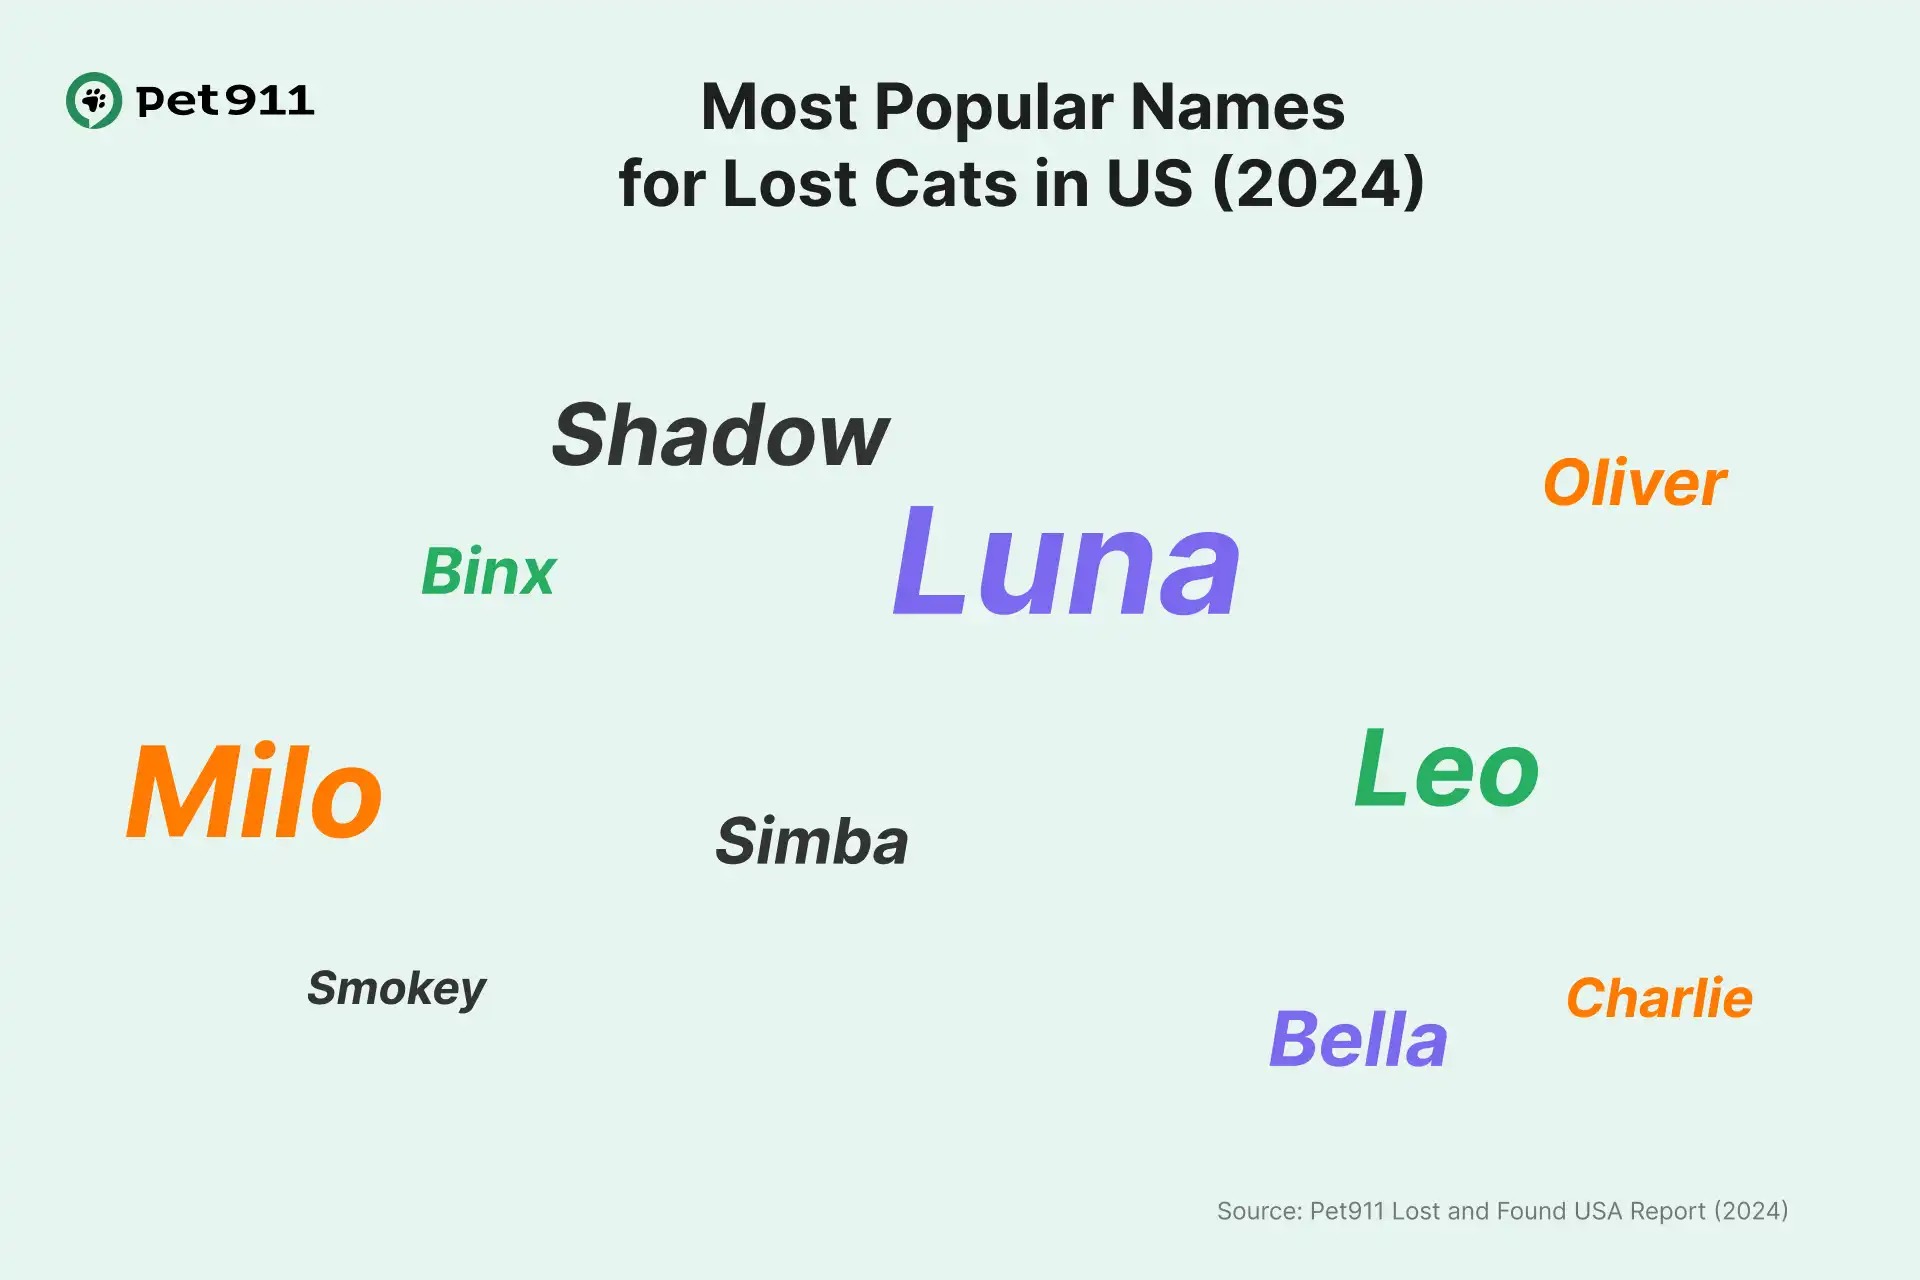
For cats, the most common names are:
- Luna
- Milo
- Leo
- Simba
- Oliver
When a particular name is very common among pets nationwide, it naturally appears more frequently in lost pet reports as well. The higher numbers of certain names among missing pets directly correlates with the popularity of these names among the general pet population.
Methodology
Data Collection
We collected over 1,500,000 records of lost and found pets in the USA from the Pet911.org platform, social media networks, forums, and specialized websites. We then filtered this data to remove non-relevant records about adoption, volunteering, and fundraising.
Data Processing
Text analysis of the records allowed us to tag the dataset with essential information:
- Record classification (lost/found)
- Animal type (dog, cat, bird, etc.)
- Breed identification
- Pet name
- Location data
- Date of incident
For this tagging process, we employed our LLM-model that was trained on previously categorized pet data.
Data Refinement
Data integrity measures included duplicate removal, geographic standardization, breed classification normalization, and chronological alignment for temporal analysis.
Projection Modeling
To estimate the total number of lost pets from online records, we constructed a projection model incorporating factors such as:
- Regional internet usage rates
- Population density
- Pet ownership statistics
- Urban/rural reporting differences
This model facilitated statistical calculations that revealed patterns in pet loss incidents, geographic distribution, and recovery outcomes.
Validation
So, we validated our findings by comparing them with previous research from veterinary associations, animal welfare organizations, and academic studies on pet loss. This cross-validation confirmed the reliability of our data and helped calibrate our projection models. In cases where our findings diverged from previous studies, we conducted additional analysis to identify potential explanations for these differences.
Limitations
Our methodology has certain constraints. Some pet losses go unreported online, rural reporting may differ from urban areas, breed identification often depends on subjective assessment, and many cases lack outcome documentation.
This approach provides what we believe to be the most accurate representation of the lost pet situation in America during 2024.